
Figure 2: MS CSF B cell mAb reactivity to EBV proteins and interaction of MS39p2w174 with EBNA1AA386–405.
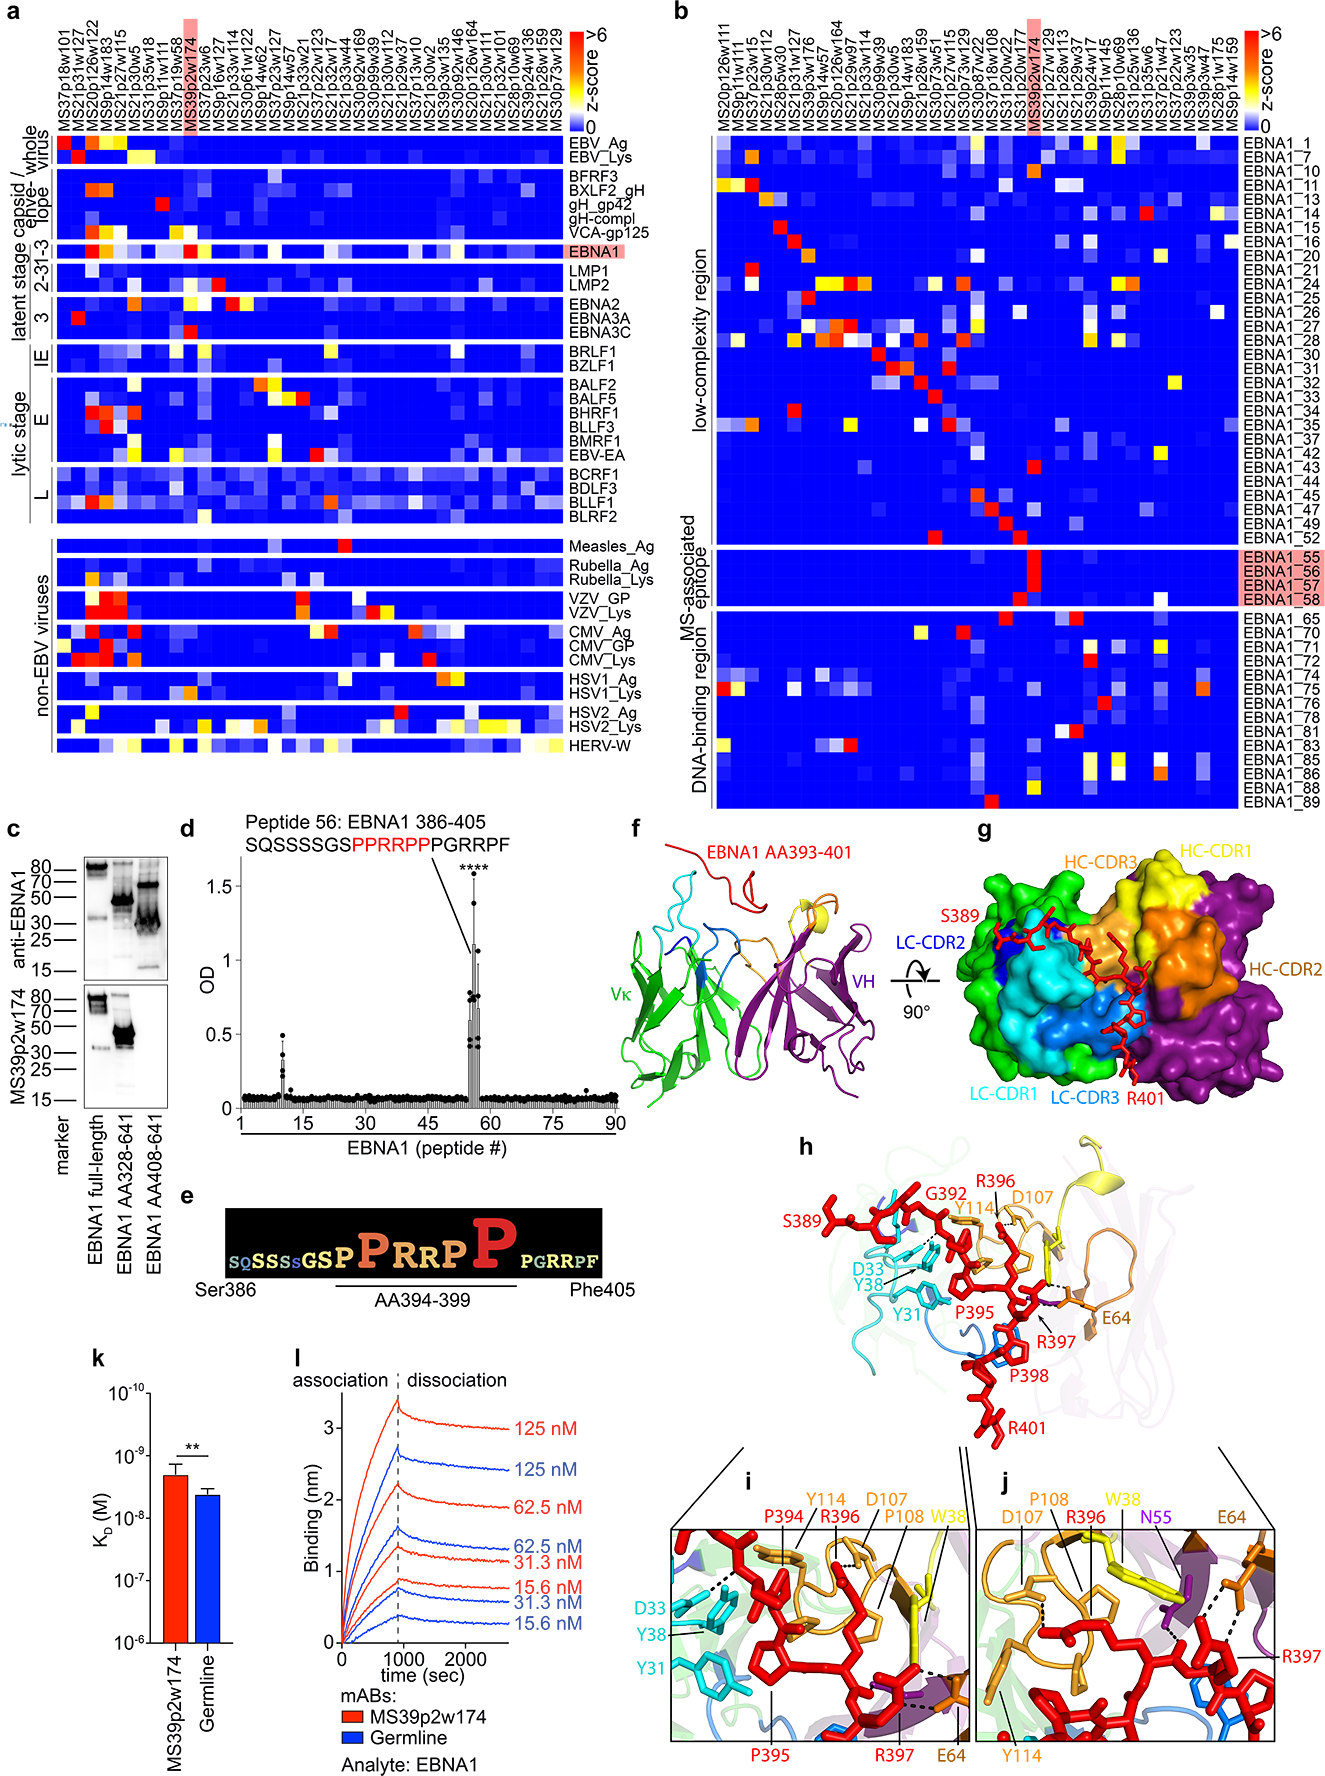
a, Protein microarray data showing MS CSF mAb reactivities (z-scores) to viral lysates and EBV proteins, b, MS CSF mAB reactivities to EBNA1 peptides. Selected mAbs with highest reactivities are shown (n=36 (a) and n=37 (b) out of n=148). Data from one experiment carried out in 8 technical replicates. IE: immediate early, E: early, and L: late lytic stage, red: mAb MS39p2w174 and antigen EBNA1 / MS-associated region. c, Western blot analysis of recombinant EBNA1 (full-length and truncated proteins), stained on separate blots with commercial anti-C-terminal EBNAI antibody (top panel) and MS39p2w174 (bottom panel), molecular weight marker in kDa. d,e, ELISA data, d, overlapping peptide scan of MS39p2w174 binding EBNA1 peptides (20mers, 13AA overlap), means ± SD of n=4 independent experiments, each measured in duplicates. e, Alanine-scan, EBNA1AA386–405 logo representation showing the contribution of each residue to binding of MS39p2w174. f-j, Crystal structure of MS39p2w174 in complex with EBNA1 AA386–405. f, Cartoon representation, showing EBNA1AA393–401 in the binding groove. Peptide (red), HC (green/blue), LC (purple/yellow/orange), CDR loop colors correspond to annotations in (g). g, View of the binding groove from the top. Surface representation of the Fab with EBNA1AA386–402 in stick representation. h, Cartoon and stick representation outlining close interactions. Major H-bond forming residues are represented as sticks. H-bonds < 3.2 Å are represented as black dashed lines. i, Magnification of peptide in the hydrophobic cage, j, magnification of region around Arg396 to emphasize polar contacts of HC residues with Arg396 and Arg397. k,l, Bio-layer interferometry measurement of MS39p2w174 (red) and germline (blue) affinity to EBNA1 full-length protein. k, KD in M, mean KD ± SD, calculated from four serial dilutions from one representative experiment out of three independent experiments, **P = 0.0043, unpaired two-tailed Student’s t test. l, association and dissociation curves corresponding to (k).