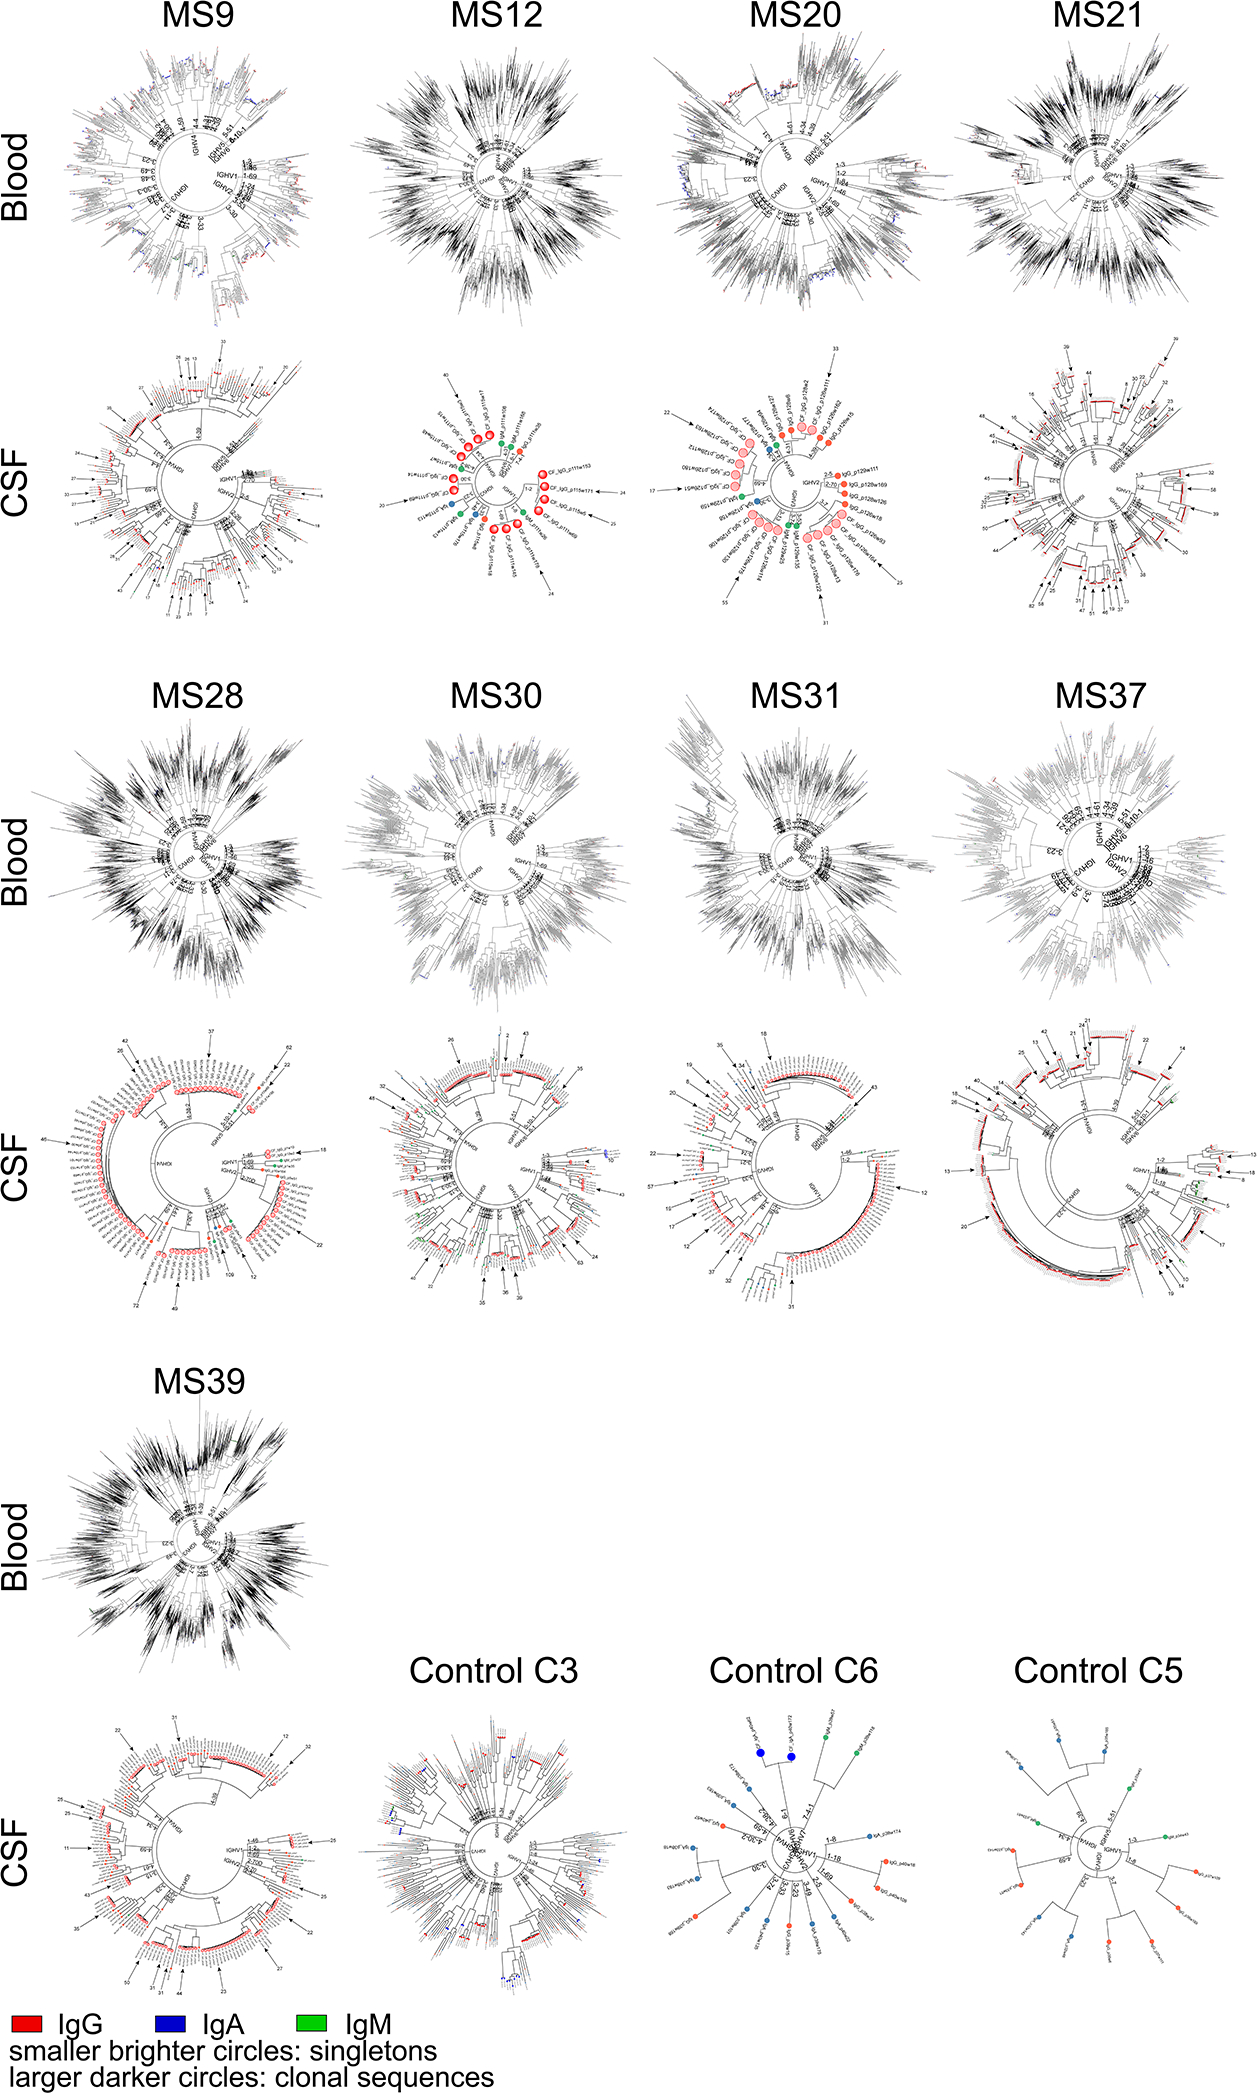
Extended Data Figure 3: Phylogenetic trees of B cells from MS blood and CSF.

Blood plasmablasts (top rows) and CSF B cells (bottom rows) of n=9 MS patients and CSF B cells of n=3 control patients are shown. Each node represents the full-length heavy chain and light chain sequence of a single B cell. Trees are binned according to their IGHV families and genes, then the concatenated heavy chain and light chain sequences are clustered. IgG (red), IgA (blue), IgM (green). Smaller brighter circles indicate singleton B cells, larger darker circles indicate clonal expansions. Arrows indicate sequences that were expressed as mAbs, numbers indicate V-gene mutation loads in heavy and light chains. Immunoglobulin heavy V gene, IGHV.
