
Fig. 2.
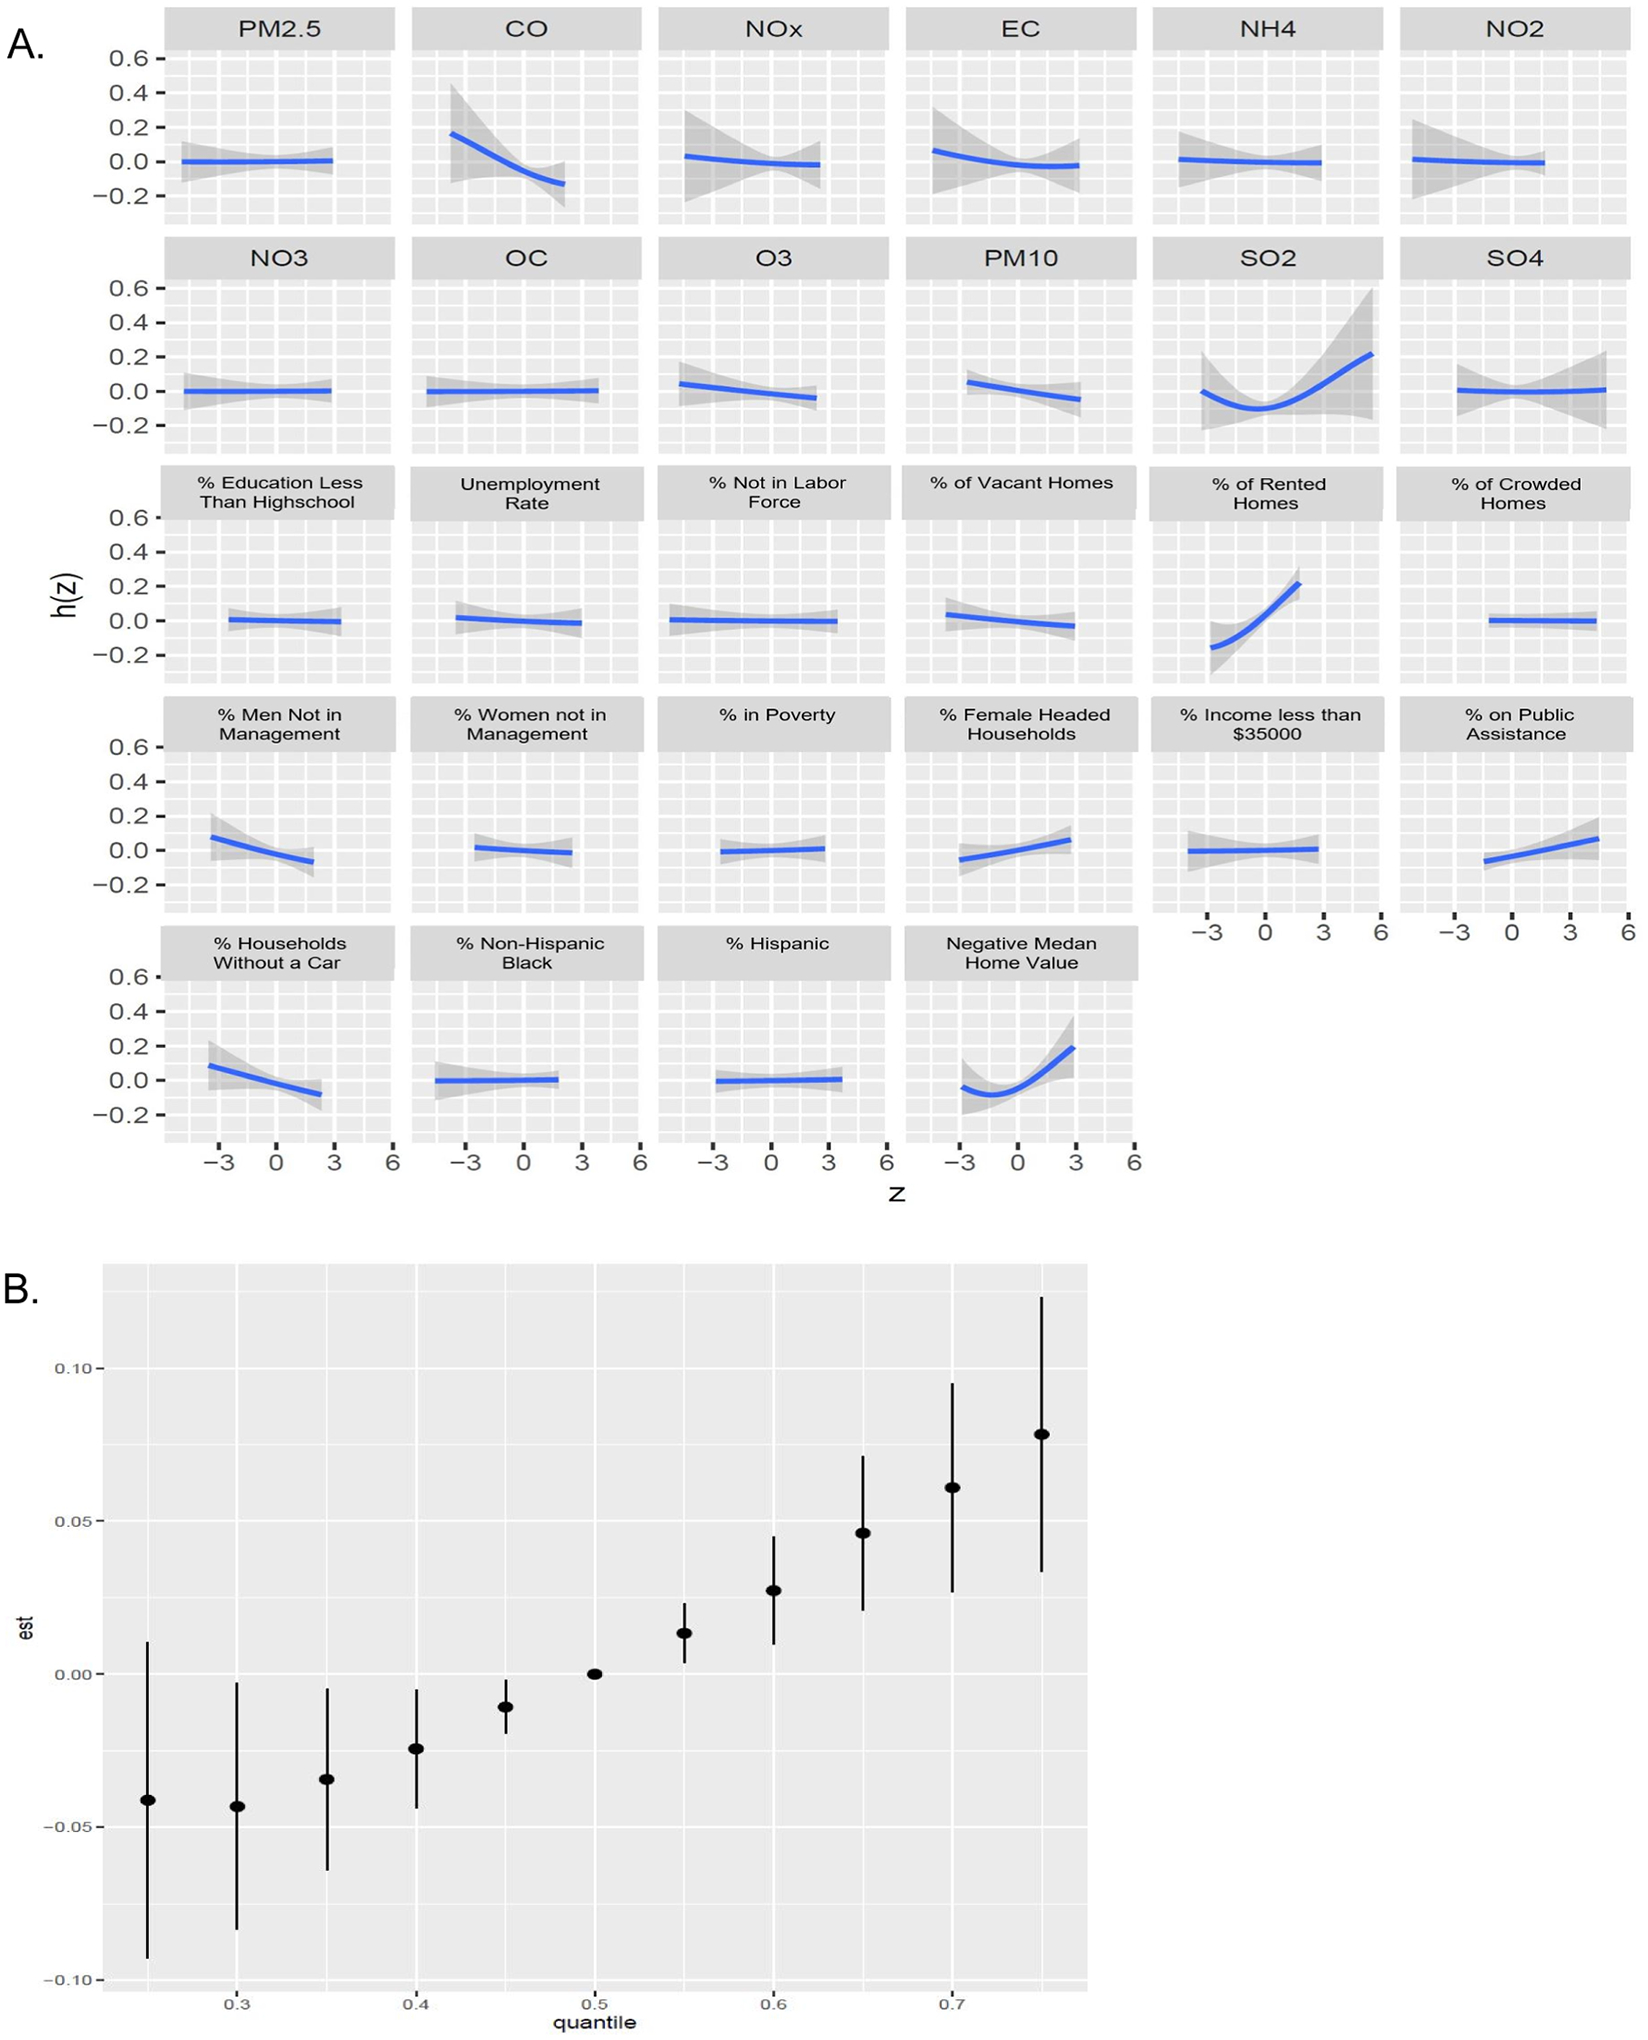
A. BKMR exposure mixture individual effects plot. The effect of each exposure holding all other exposures at their median and controlling for confounders. The y-axis for each plot represents the exposure response function (h), while the x-axis represents the centered exposure level. 95% credible interval shown in grey. B. BKMR exposure mixture overall effects plot. The effect of all exposures in the mixture at each decile compared to the effect of all exposures in the mixture at the median, and 95% credible interval.