
Fig. 3.
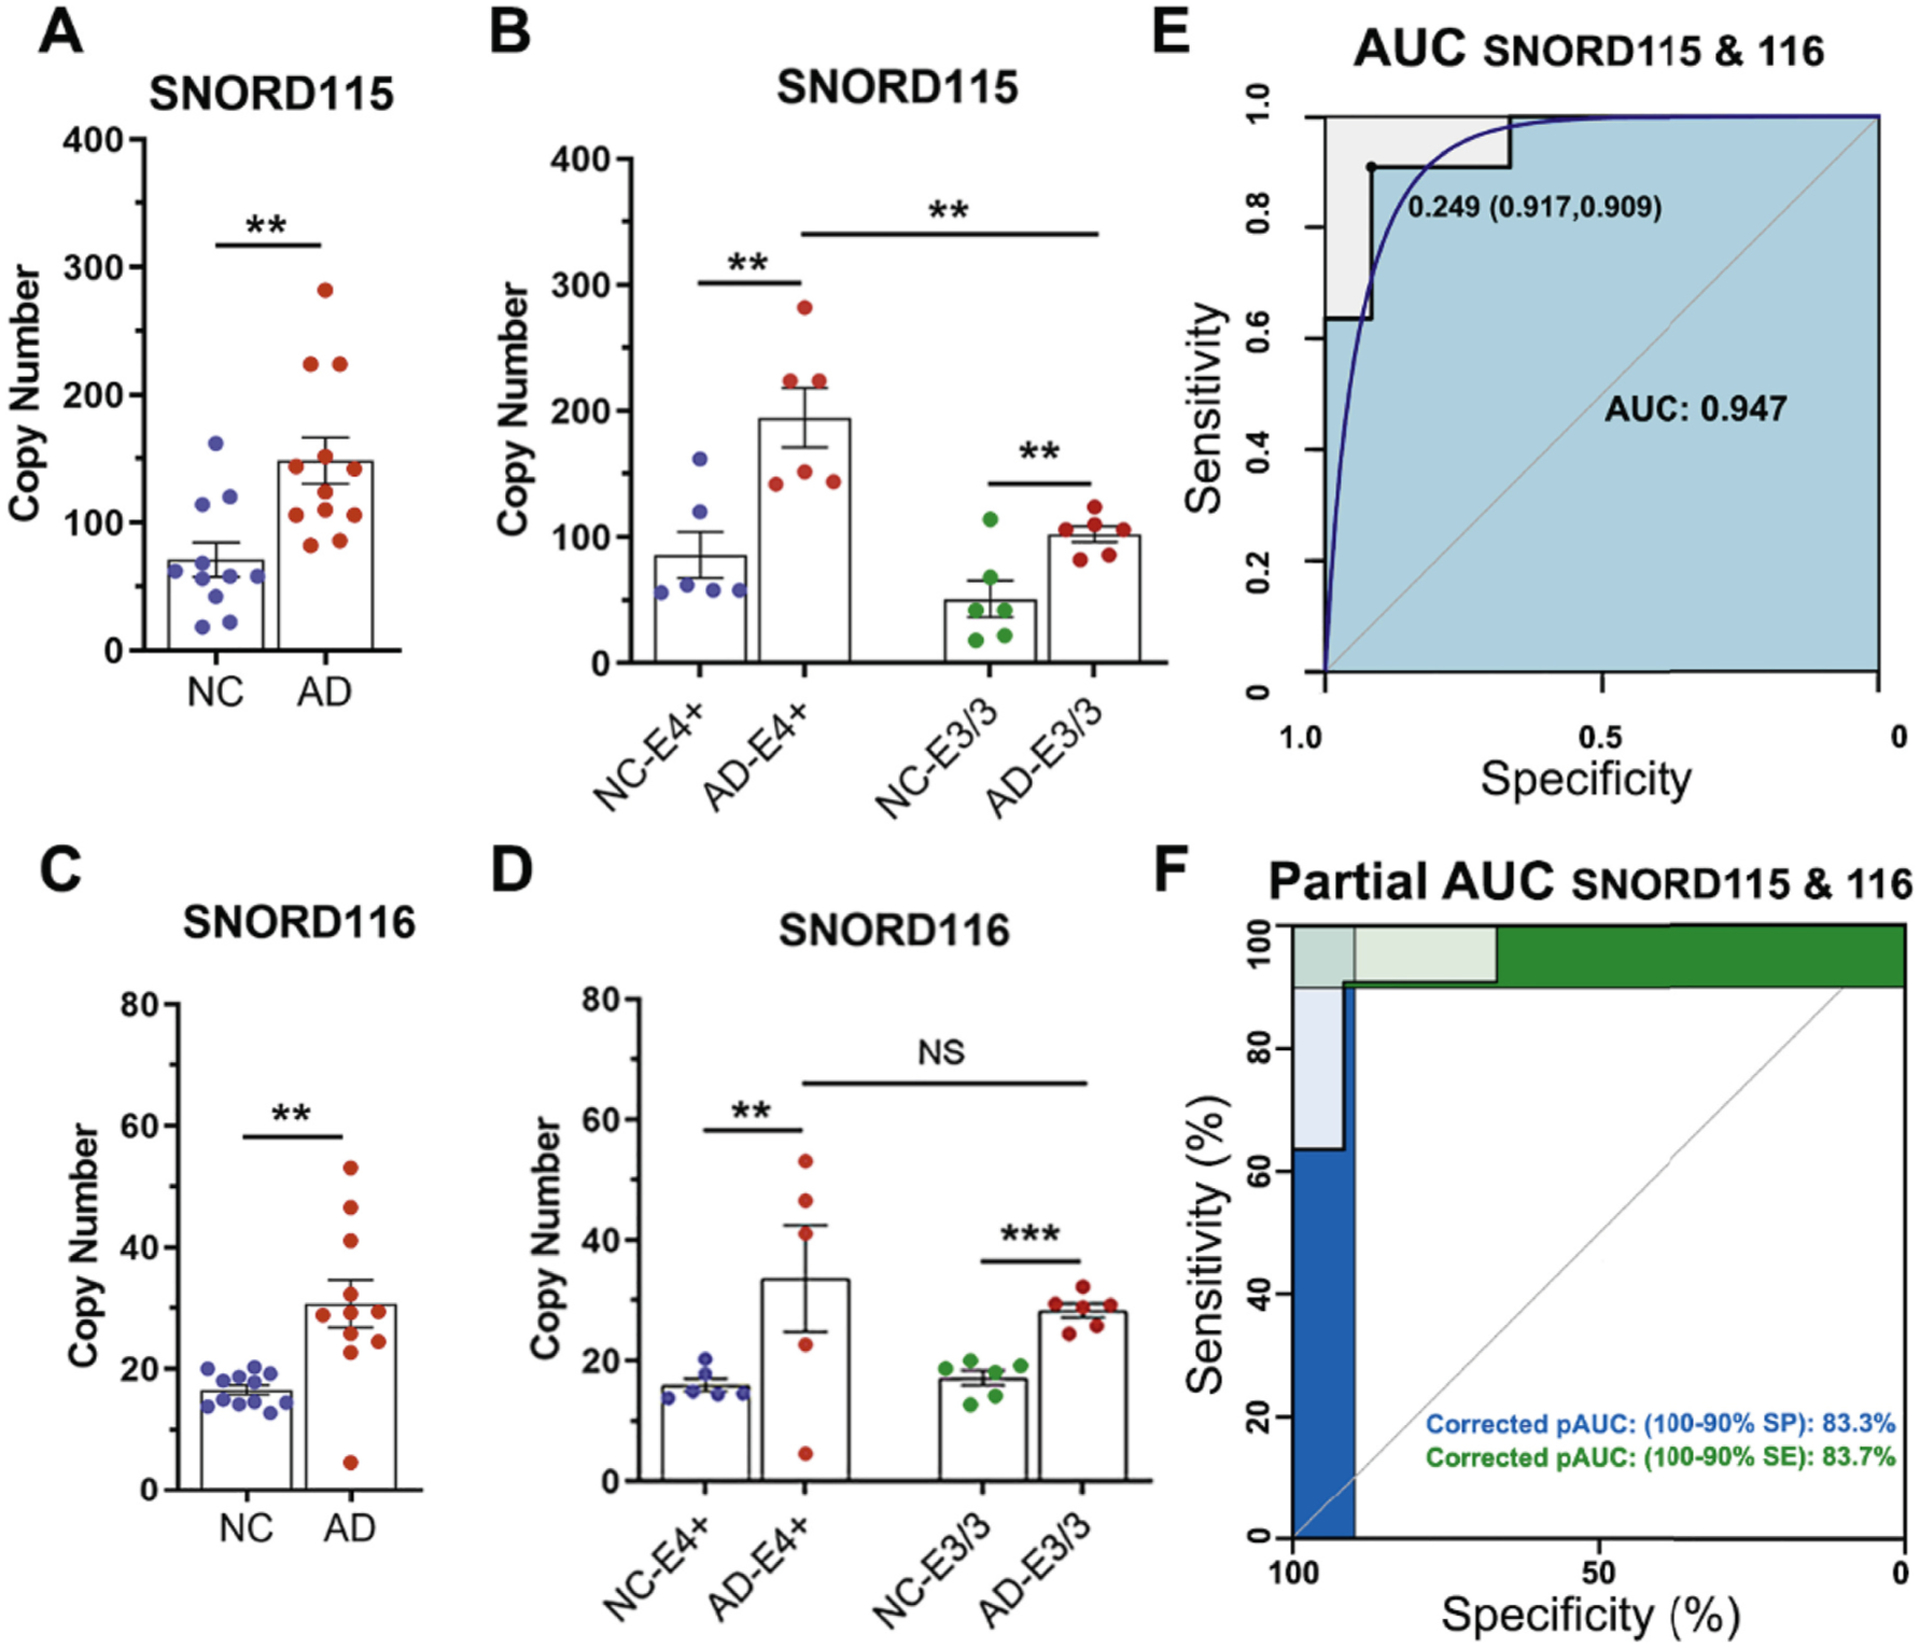
Enrichment of SNORDs in plasma EV as AD predictors. In the verification phase EV were isolated from plasma samples of a separate cohort of AD patients and NC individuals (independent of the Discovery phase) and assessed using ddPCR. (A-D) Scatter plots depict the abundance of SNORD115 (A) and 116 (C) in plasma EV isolated from NC (N = 12) and AD patients (N = 12). Statistical significance determined by unpaired t-test. (C–D) Scatter plots depict the effect of APOE genotype on enrichment of SNORD115 (B) and SNORD116 (D) in EV of NC and AD plasma samples. Statistical significance determined by t-test.**p < 0.01; ***p < 0.001; NS, No Significance; N = 6 per isoform. (E-F) ROC analysis showing the AUC (E) and corrected Partial AUC (F) for combined SNORD115 & 116 data. The blue line on E is the smoothed ROC curve. In addition to AUC we show the copy number threshold with the highest sum of sensitivity and specificity.