
Fig. 2. 6mASCOPE method evaluation.
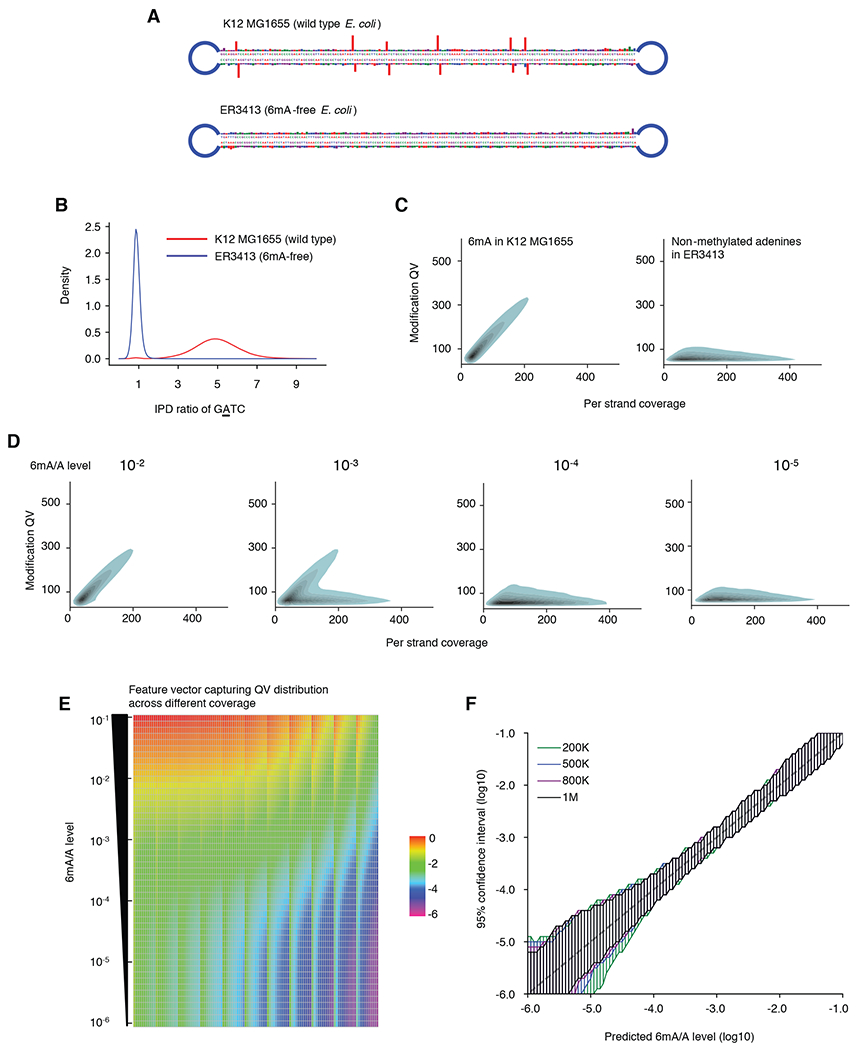
(A) IPD ratios on illustrative molecules from E. coli wild type strain K12 MG1655 and 6mA-free strain ER3413. Blue segment: SMRT adapter. (B) IPD ratio of adenines on GATC motif in E. coli K12 MG1655 and ER3413. 6mA events have IPD ratios ~5 while non-methylated adenines have IPD ratios ~1. (C) Modification Quality values (QVs) of 6mA linearly (slope ~1.7) deviate from the non-methylated adenines with better separation at high CCS passes. For illustration, kernel density estimation of adenines with QV 50 is shown. Left, 6mA in GATC, GCACNNNNNNGTT and AACNNNNNNTGC from E. coli K12 MG1655. Right, non-methylated adenines in E. coli ER3413. (D) QV distribution varies across different 6mA/A levels. Same legend as in (C). (E) Feature vectors used for machine learning model training. Rows: 51 6mA/A levels (10−1 to 10−6) are constructed by mixing negative and positive controls in silico at different ratios. Each column represents the percentage (averaged across 300 replicates, log10 transformed) of adenines over a number of slopes across CCS passes 20-240x, divided into 11 bins (Methods). (F) For each 6mA quantification (x-axis), 6mASCOPE also provides the 95% confidence interval (y-axis) (Methods). Colors represent the number of CCS reads used for 6mA quantification.