
Fig. 3. 6mASCOPE discovers high resolution 6mA deposition in C. reinhardtii and T. Thermophila.
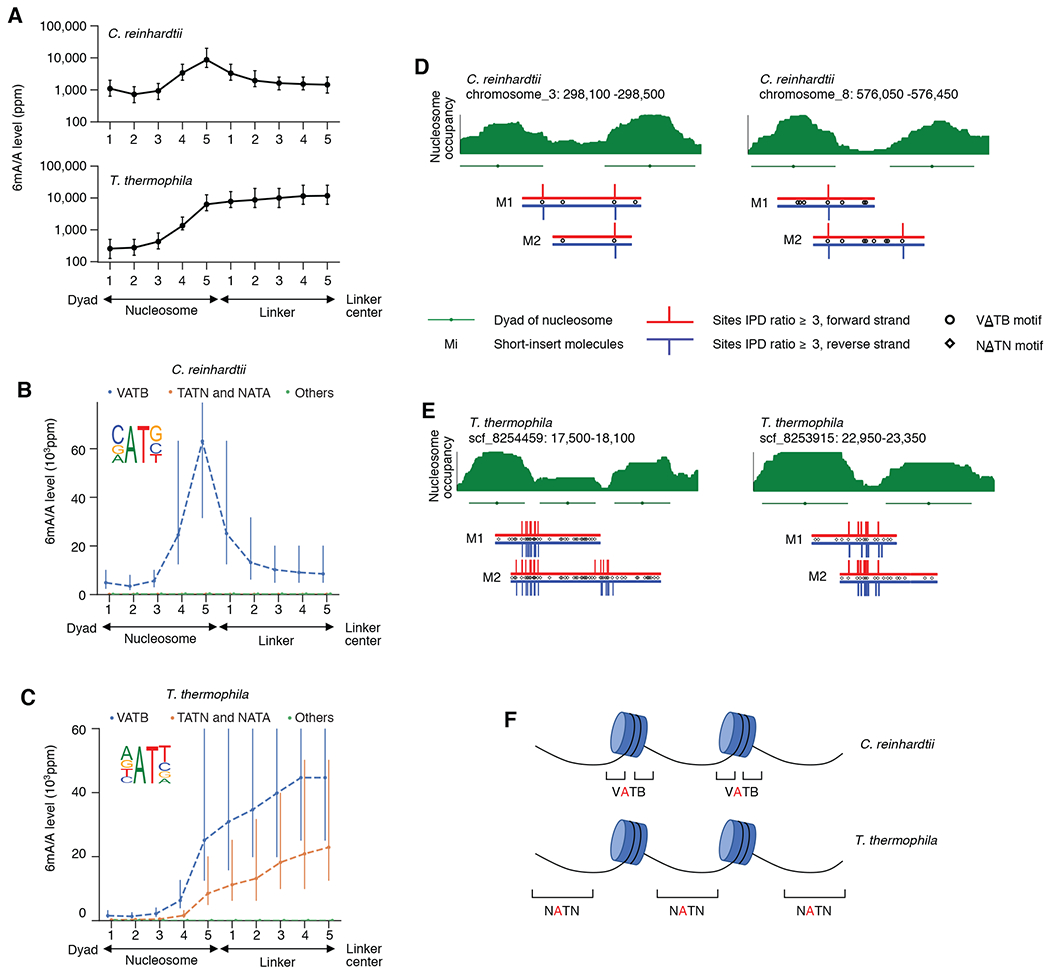
(A) 6mA deposition relative to nucleosomes and linkers in C. reinhardtii and T. thermophila. Genomic regions between the nucleosome dyad and the linker center are divided into ten bins (x-axis) across the genome. 6mA/A level (y-axis) was quantified with 6mASCOPE. Error bars: 95% CIs. (B) 6mA is enriched in VATB motif at nucleosome-linker boundaries in C. reinhardtii. Adenines in each bin are divided into three groups: VATB, TATN/NATA, and others. x- and y-axes are the same as in (A). Error bars: 95% CIs. (C) 6mA is enriched across the NATN motif at linkers in T. thermophila. Same legend as in (B). (D) and (E), Illustrative examples of 6mA enrichment in C. reinhardtii (D) and T. thermophila (E). Nucleosome occupancy (green stack) is based on MNase-seq data (Methods). Nucleosomes (green lines) and dyads (green dots) are determined by iNPS(v1.2.2). SMRT CCS reads (Mi) are shown with red (forward strand) and blue (reverse strand) lines. IPD ratios 3 are shown. (F) Schematic of 6mA enrichment at the nucleosome-linker boundaries in C. reinhardtii, and the gradual 6mA increase from nucleosome boundaries to linker centers in T. thermophila.