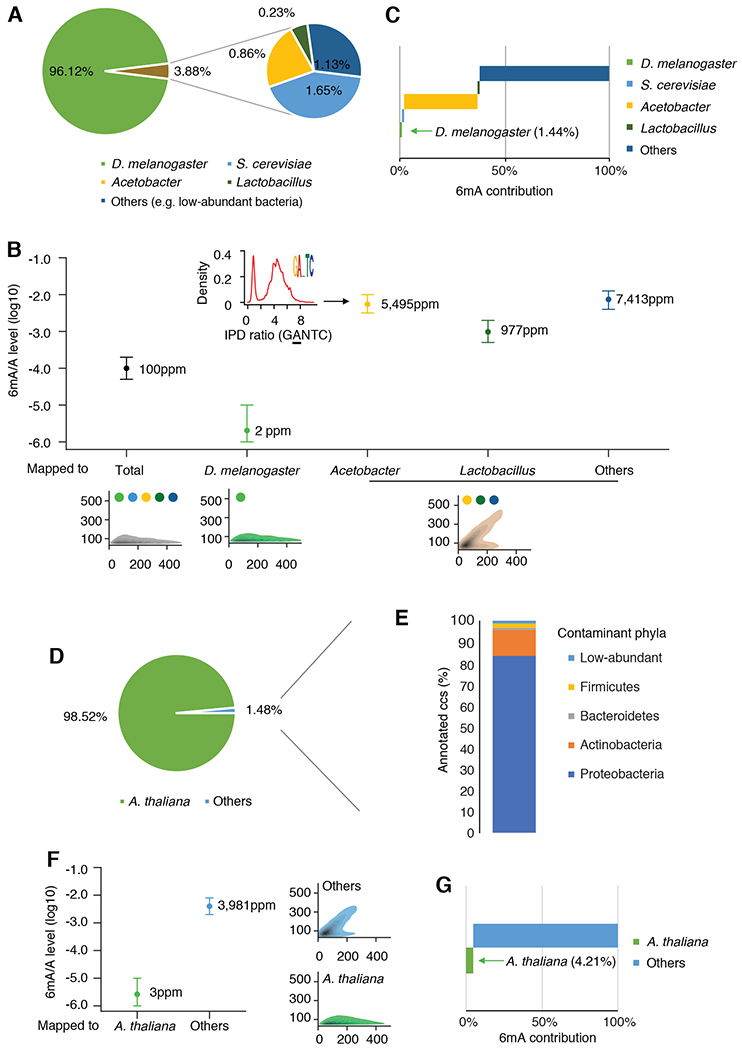
Fig. 4. 6mASCOPE analyses show that commensal bacteria contribute to the vast majority of 6mA events in insect and plant samples.

(A) Taxonomic compositions (%) in the D. melanogaster embryo ~0.75h gDNA sample. CCS reads mapped to Acetobacter or Lactobacillus are summarized by genus. (B) 6mA quantification of the D. melanogaster genome and contaminations. For each subgroup, 6mA/A levels are quantified by 6mASCOPE (error bars: 95% CIs). QV distributions are shown at bottom (color dots: species/genus). 6mA/A level of S. cerevisiae is further examined with additional sequencing (Fig. S9). CCS reads from Acetobacter, Lactobacillus and Others (e.g. low-abundant bacteria) are grouped together due to low CCS read counts within each subgroup and CIs are defined based on 8,000 CCS reads. Arrow denotes the density of IPD ratios in GANTC motif in Acetobacter. (C) 6mA contribution (%) from each subgroup in the D. melanogaster embryo sample. (D & E) Taxonomic compositions (%) in the A. thaliana 21-day seedling gDNA sample. The CCS reads in subgroup “Others” (D) are taxonomy classified with Kraken2. Main classes of Proteobacteria are shown in Fig. S12. (F) 6mA quantification of the A. thaliana genome and the contamination (Others). Same legend as in (B). (G) 6mA contribution (%) from each subgroup in the A. thaliana seedling sample.
