
Figure 3. Phosphorylation of endothelial NO synthase (eNOS) and Akt induced by NIR-II exposure.
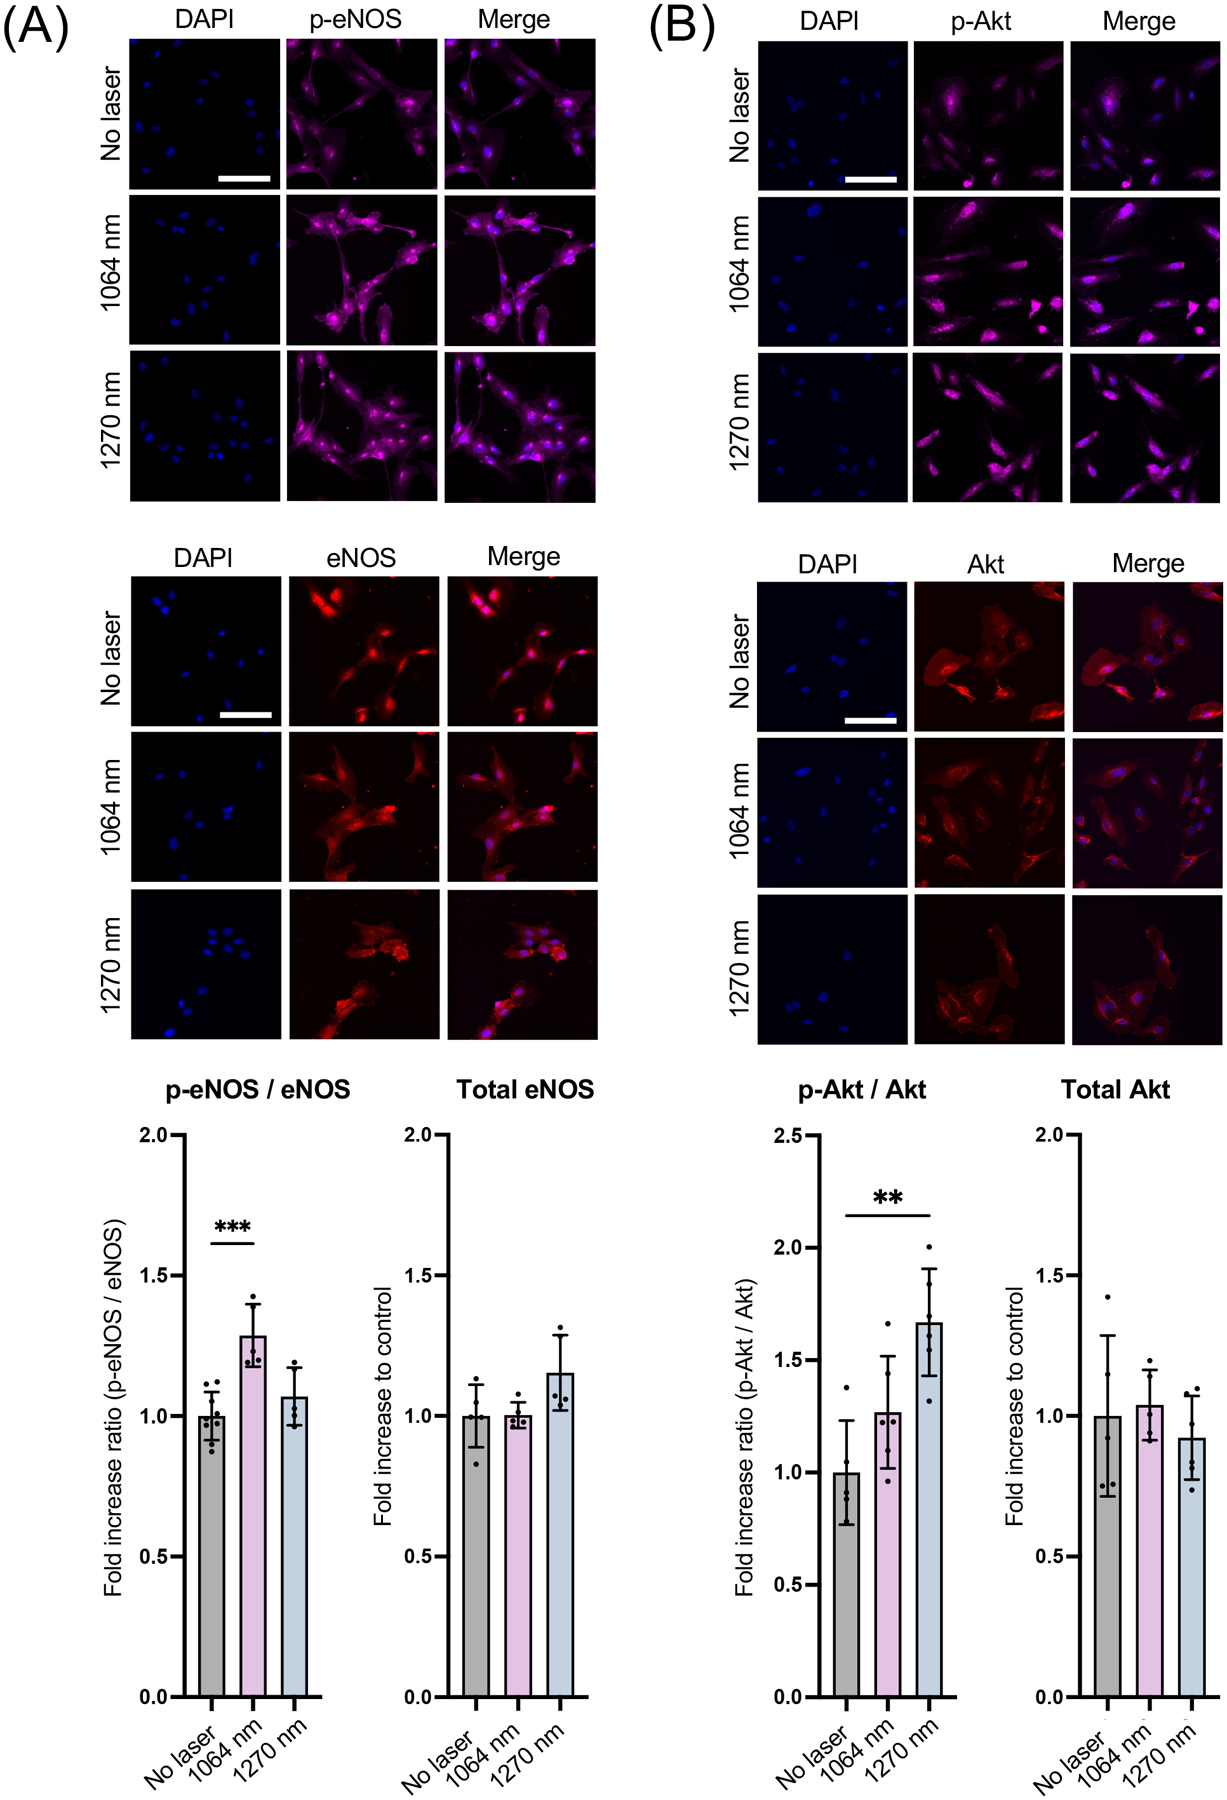
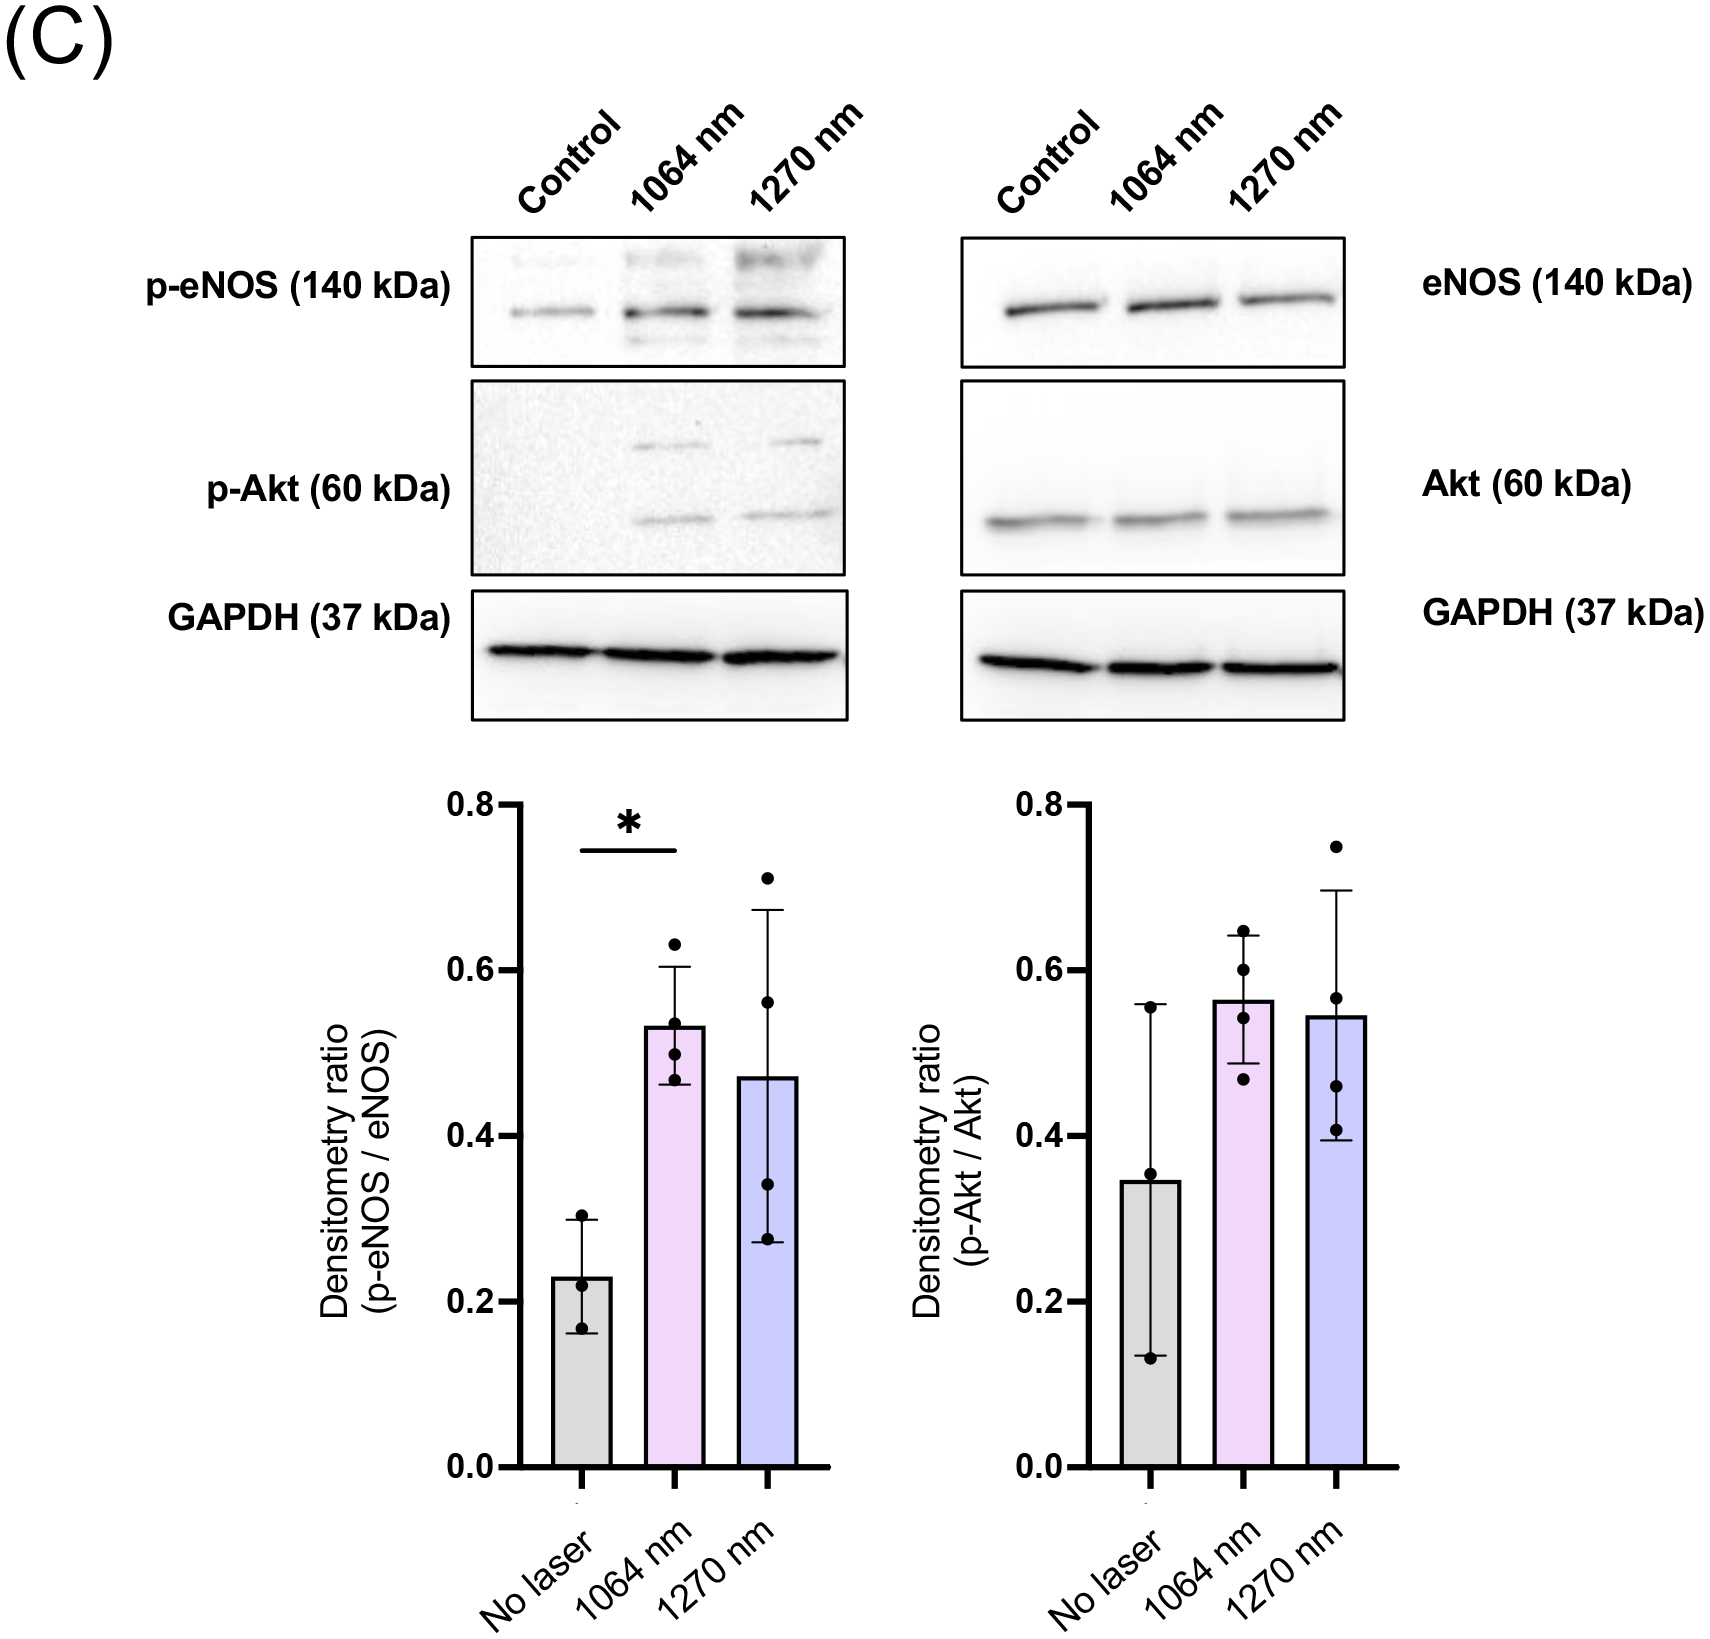
Cultured HUVECs were exposed to 1064 or 1270 nm laser at an irradiance of 10 mW/cm2 for 5 min. After 30 min incubation in serum-free media, cells were stained with anti-phospho Akt or phospho eNOS, anti-total Akt or eNOS followed by appropriate secondary antibody conjugated to the fluorophore and imaged using an epifluorescence microscope. The fold change of the fluorescent signals at each time point over the no laser control group was calculated. A-B (top) Representative fluorescence images of the cells immunostained for A, total eNOS and phospho-eNOS and B, total Akt and phospho-Akt. Scale bars = 100 μm. A-B (bottom), Quantitative measurements of fold changes in the fluorescence intensity of A, p-eNOS and total eNOS and B, p-Akt and total Akt. A-B, Results were pooled from three independent experiments. n = 5–6 cell preparations for each group. C, Immunoblot analysis of cultured HUVECs exposed to 1064 or 1270 nm laser at an irradiance of 10 mW/cm2 for 5 min. After 30 min incubation in serum-free media, cells were lysed, and cell lysates were analyzed by immunoblot analysis. GAPDH was used as the loading control. The membrane was probed with anti-phospho eNOS or anti-phospho Akt, anti-total eNOS or Akt. C (Top), Representative micrographs of the immunoblot analysis. C (Bottom), Quantitative measurements of eNOS and Akt phosphorylation by densitometric analysis using ImageJ. Results were pooled from three independent experiments. n = 3–4 cell preparations for each group. A-C, Error bars denote SEM. A P value less than 0.05 was considered significant: * P < 0.05; ** P < 0.01; *** P < 0.005 by one-way ANOVA followed by Tukey’s multiple comparison test.