
Figure 5. Role of mitochondrial retrograde signaling in NO generation by NIR-II exposure.
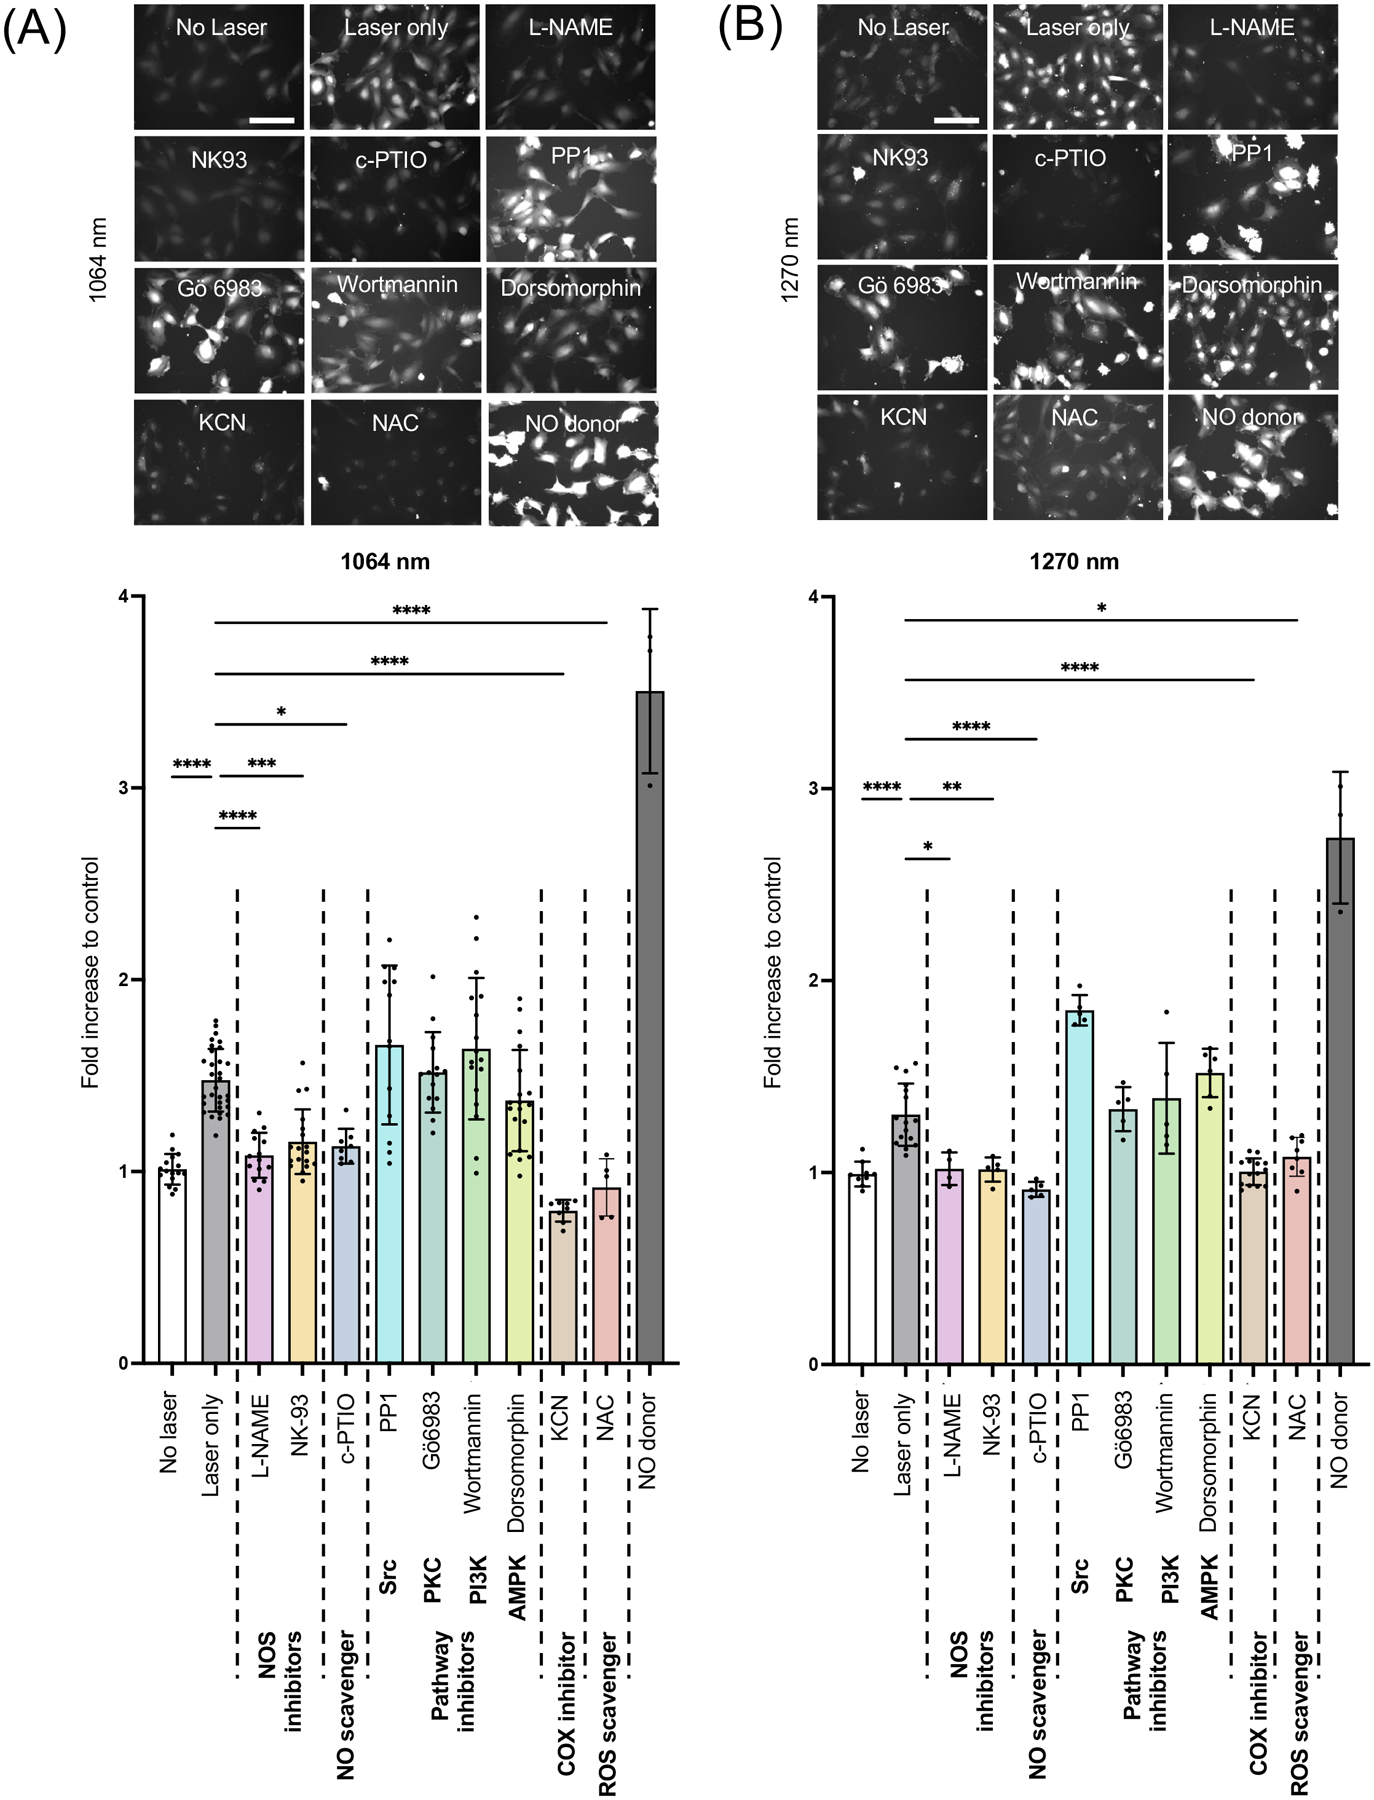
Cultured HUVECs were serum-starved for 1 h and pre-treated with L-NAME, c-PTIO, NK-93, Wortmannin, Dorsomorphin, PP1, or Gö6983 for 1 h before the laser treatment. Cells were then exposed to 1064 nm laser at an irradiance of 10 mW/cm2 for 5 min. NO generation was determined using DAF-2 DA. A-B (top) Representative fluorescence images of each experimental group. Scale bar = 100 μm. A-B (bottom) Quantitative measurements of fold changes in DAF-2 fluorescence intensity corresponding to the images in A. Results were pooled from three independent experiments. n = 5–31 cell preparations for each group. Error bars denote SEM. A P value less than 0.05 was considered significant: * P < 0.05; ** P < 0.01; *** P < 0.005; **** P < 0.0001 by one-way ANOVA followed by Tukey’s multiple comparison test.