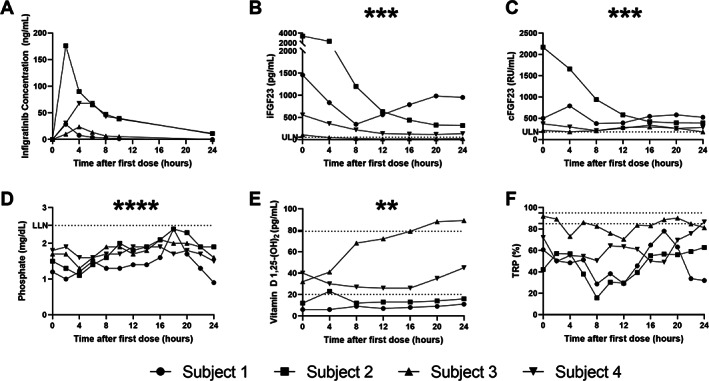
Fig. 1.

Twenty‐four‐hour pharmacokinetics and pharmacodynamics following the initial infigratinib 75 mg dose. (A) Infigratinib concentration, (B) iFGF23, (C) cFGF23, (D) phosphate, (E) 1,25D, (F) TRP. Horizontal dotted lines indicate the ULN and LLN. iFGF23, cFGF23, phosphate, and 1,25D showed a significant change from baseline (0 hour) using linear mixed effects modeling. *p < 0.05; **p < 0.01; ***p < 0.001; ****p < 0.0001. LLN = lower limit of normal; ULN = upper limit of normal.
