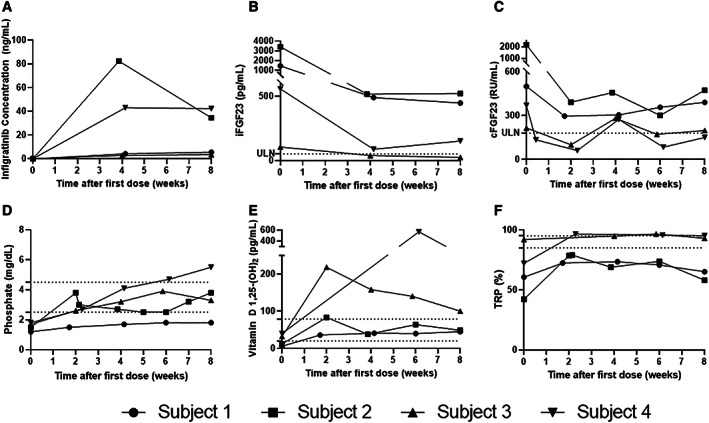
Fig. 2.

Pharmacokinetics and pharmacodynamics over the first 8 weeks on fixed dosing of infigratinib 75 mg daily. (A) Infigratinib concentration, (B) iFGF23, (C) cFGF23, (D) phosphate, (E) 1,25D, (F) TRP. Horizontal dotted lines indicate the ULN and LLN. Linear mixed effects modeling demonstrated significant changes from baseline in cFGF23, phosphate, and 1,25D. *p < 0.05; **p < 0.01; ***p < 0.001; ****p < 0.0001. LLN = lower limit of normal; ULN = upper limit of normal.
