Fig. 5.
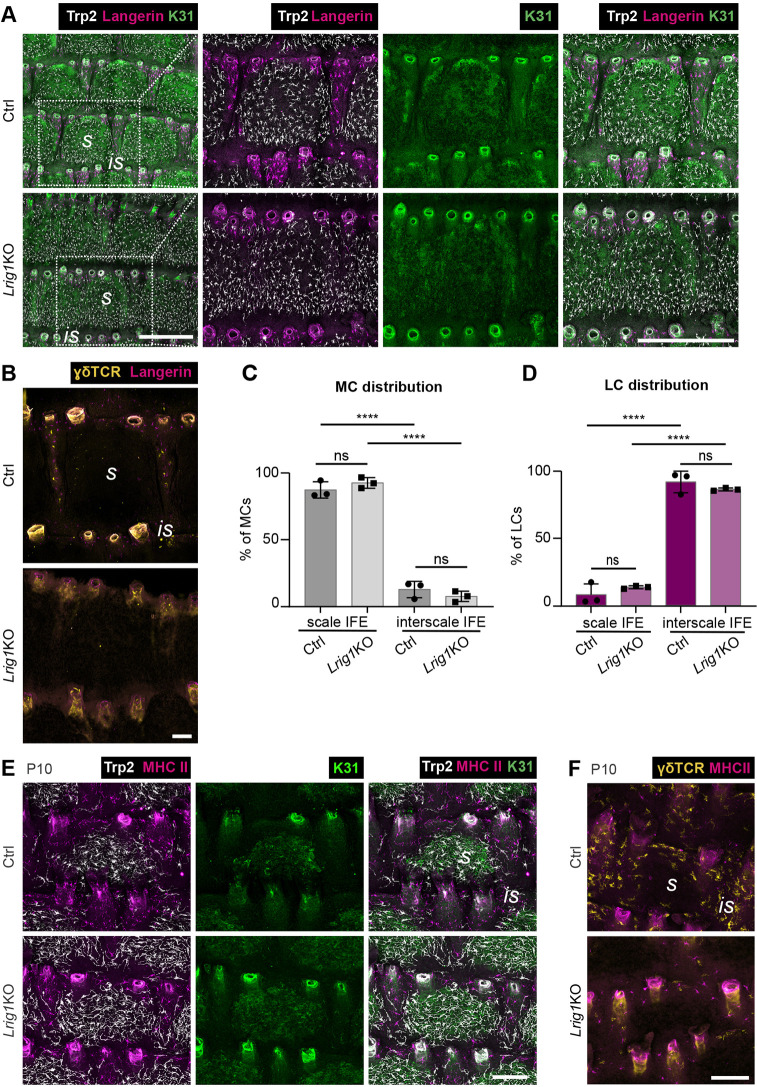
MC:immunocyte distribution dynamically adapts to changes of epidermal scale:interscale patterning in Lrig1 KO mice. (A) Langerin, Trp2 and K31 immunostaining of tail epidermis wholemounts from 3-month-old control and Lrig1 KO mice. Representative for n=3. Right panels show magnification of boxed area in left panels. (B) γδTCR and langerin immunostaining of tail epidermis wholemounts from 3-month-old control and Lrig1 KO mice. Representative for n=3. (C) Quantification of A: MC distribution per scale:interscale unit (% of MCs). MC numbers in each compartment (scale, interscale) were normalized to the total MC number per scale:interscale unit. n=3; ns, P=0.6203; ****P<0.0001; mean±s.d.; one-way ANOVA/Tukey's multiple comparisons test. (D) Quantification of A: LC distribution per scale:interscale unit (% of LCs). LC numbers in each compartment (scale, interscale) were normalized to the total LC number per scale:interscale unit. n=3; ns, P=0.6504; ****P<0.0001; mean±s.d.; one-way ANOVA/Tukey's multiple comparisons test. (E) MHCII, Trp2 and K31 immunostaining of tail epidermis wholemounts from control and Lrig1 KO mice at P10. Representative for n=4. (F) MHCII and γδTCR immunostaining of tail epidermis wholemounts from control and Lrig1 KO mice at P10. Representative for n=4. is, interscale; s, scale. Scale bars: 500 µm (A); 100 µm (B,E,F).

