Fig. 2.

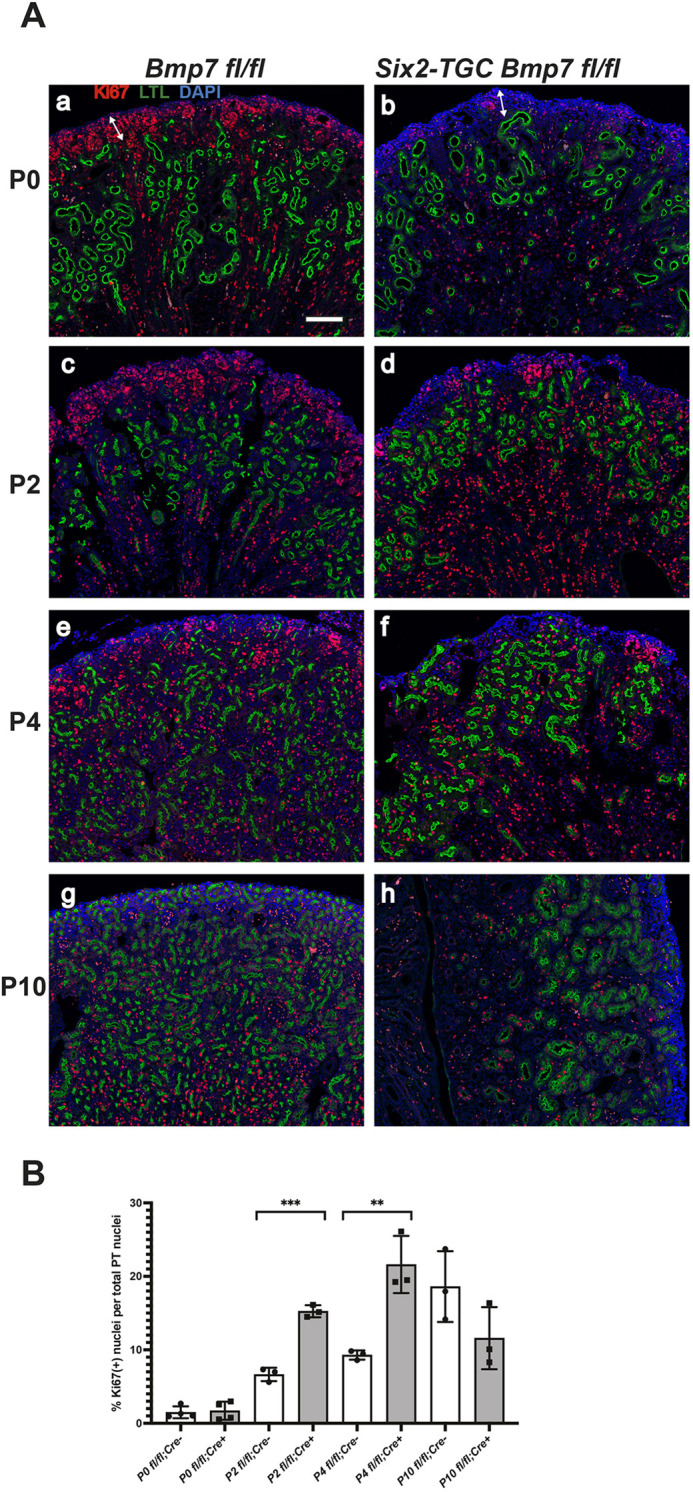
Proliferation in proximal tubules. (A) Sections from P2 kidneys (Aa-Ah) are stained for LTL (green), Ki67 (red) and DAPI (blue). Controls are shown in left column, Bmp7 mutants in the right column. Postnatal day indicated at left of each row. Double-headed arrows in (Aa,Ab) delimit nephrogenic zone. Scale bar: 100 µm. (B) Quantification of Ki67+ nuclei per nuclei of LTL-stained tubules at each time point. Data are mean±s.d. ***P<0.001, **P<0.01 (unpaired two-tailed t-test). Three biological replicate kidneys were examined at each time point.
