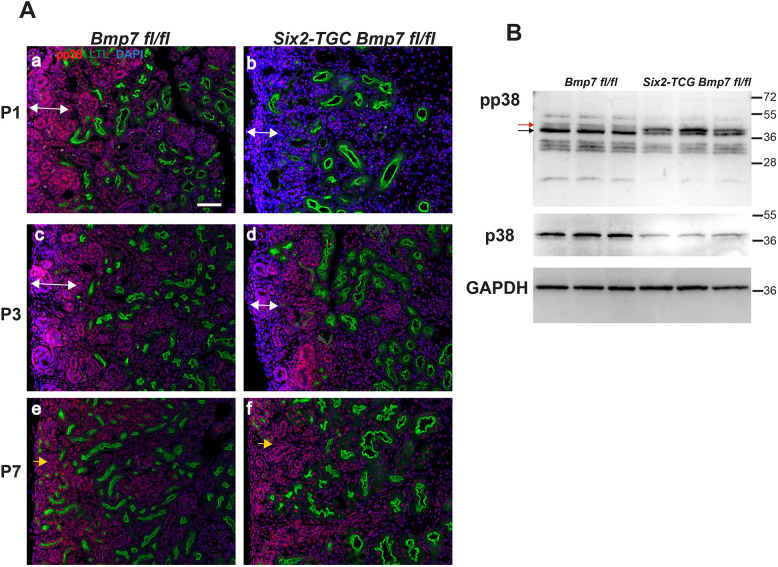
Fig. 6.
(A) Phospho-p38 staining in P2 kidneys. (A) Sections (Aa-Af) are stained for LTL (green), pp38 (red) and DAPI (blue). Controls are shown in the left column, Bmp7 mutants in the right column. The double headed arrow delimits the extent of the nephrogenic zone containing immature structures. By P7 the nephrogenic zone has disappeared. Yellow arrows (Ae,Af) indicate areas of pp38 in the more peripheral cortex. Scale bar: 100 µm. (B) Western blot for pp38. The black and red arrows indicate the doublet band in the mutant at 38 kd.

