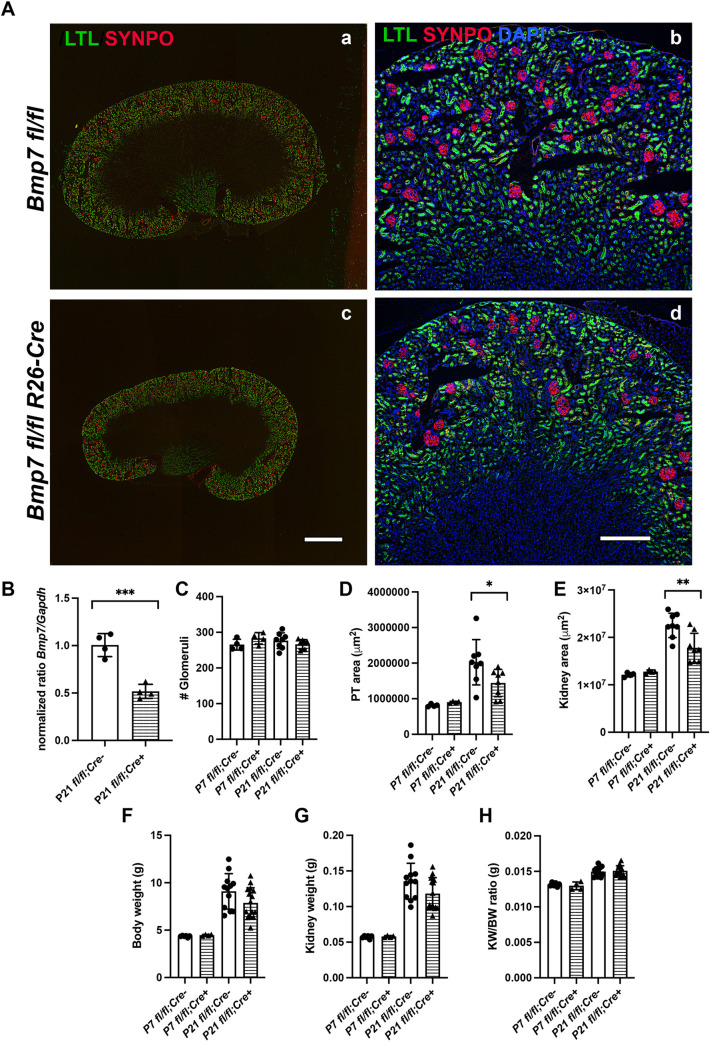
Fig. 8.
Quantification of R26 Bmp7 mutant kidneys. (A) Representative LTL/synaptopodin images used for quantification shown in (B-E). Scale bars: 1 mm (Aa,Ac); 250 µm (Ab,Ad). (B-H) All analyses show multiple biological replicates comparing controls and R26 Bmp7 mutants at P7 and P21. (B) RT-qPCR for Bmp7 in P21 kidneys. (C) Glomerular quantification. (D) Proximal tubule area based on LTL stain. (E) Kidney cross-sectional diameter at widest diameter section through papilla. (F) Body weight of mice. (G) Kidney weight. (H) Ratio of kidney to body weight. Data are mean±s.d. ***P<0.001, **P<0.01, *P<0.05 (unpaired two-tailed t-test). At least three biological replicate kidneys were examined at each time point.

