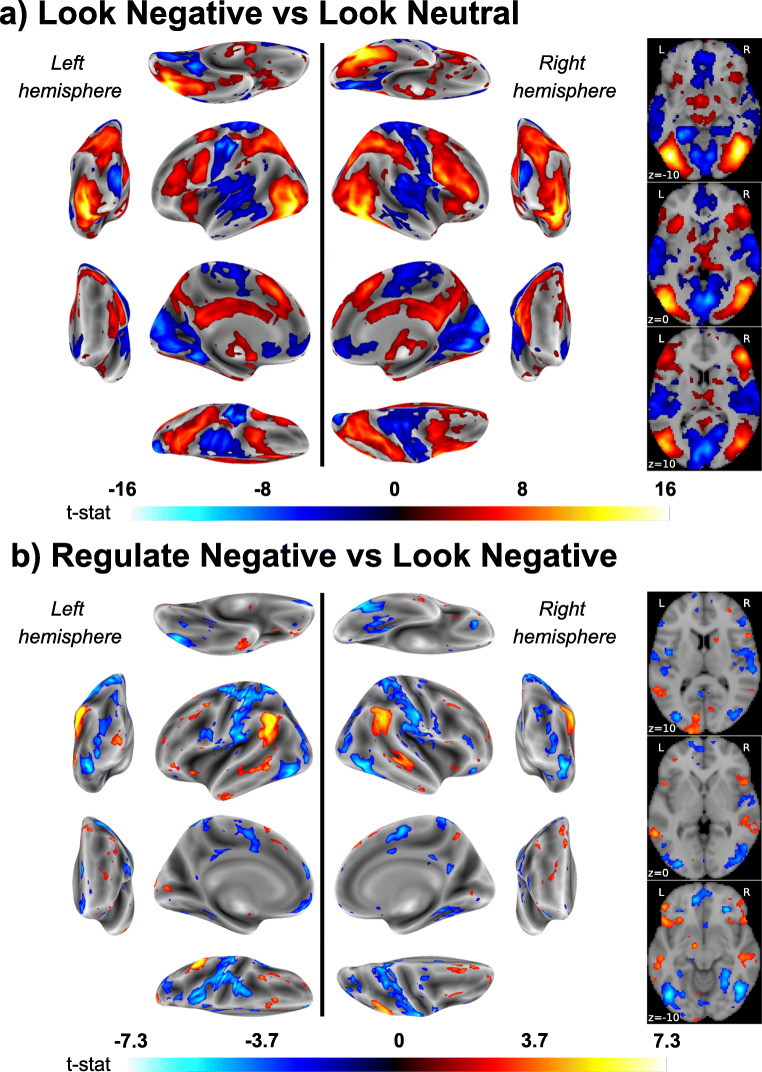
Fig. 2.
Color-scaled T-maps of brain areas exhibiting significant BOLD signal changes for the contrasts of (A) “Look Negative vs. Look Neutral” trials and (B) “Regulate Negative vs. Look Negative” trials. Maps in A–B correspond to statistical parametric T-maps and are shown at a false discovery rate (FDR) threshold of 0.05. On the left, map values are projected on the lateral, medial, dorsal, ventral, anterior and posterior brain surfaces for both hemispheres. On the right, axial planes are depicted for to z coordinates of − 10, 0 and 10. Warmer colors (red-orange) reflect relative increases in activity, whereas cooler colors (blue) reflect relative decreases

