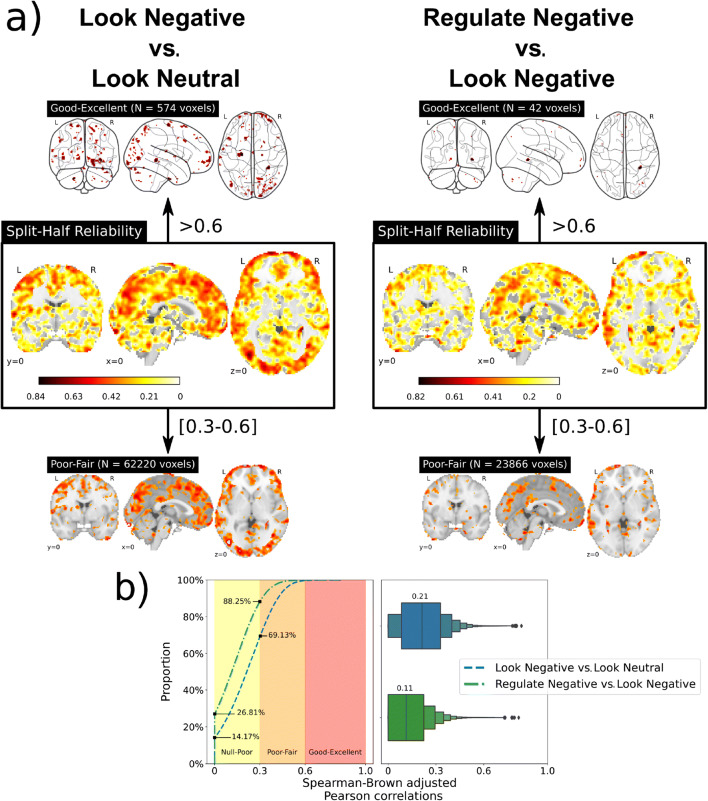
Fig. 3.
(a) Whole-brain voxel-wise intraclass coefficient (ICC) summaries that reflect the split-half internal consistencies of the “Look Negative vs. Look Neutral” contrast maps and “Regulate Negative vs. Look Negative” contrast maps. To aid in visualizing the “good-excellent” ICC range due to the scarcity of voxels, glass brain plots were employed. (b) Comparison of reliabilities from both contrast maps using the empirical distribution function and box plots that reflect the median and distribution of the ICC values

