Fig. 5.
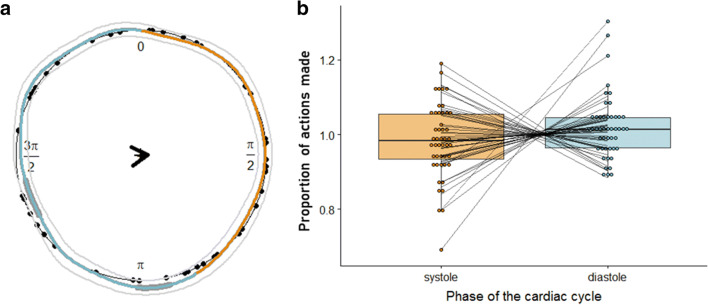
Circular (a) and binary (b) analysis of the timings of key presses (action timing) relative to the cardiac cycle. a Circular distribution of individual mean actions (black dots, N = 47) across the cardiac cycle (from R peak to R peak). On average, participants mainly made actions is the early phase of the cardiac cycle (weighted overall mean as black arrow). Based on a bootstrapping procedure, we computed the mean circular density of picture onsets (coloured line) as well as a 95% CI (within inner and outer thin grey lines). Segments of the cardiac cycle are determined as statistically significant (thick grey segments) when the circular density significantly differs from the circular uniform (i.e., the lower bound of the CI is outside of the black uniform circle). To relate segments of the cardiac cycle to the two cardiac phases (systole = orange, diastole = blue), overall mean systole and diastole lengths were obtained, showing that both of the significant density segments fall into diastole. b The relative proportion of actions for systole and diastole. The proportions of actions were normalised for the duration of systole and diastole, respectively

