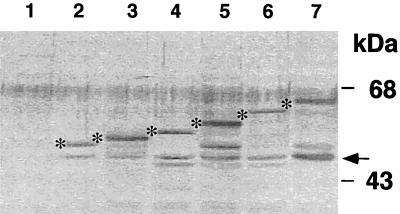
FIG. 3.
Western blot analysis of MntC-PhoA fusion proteins expressed in E. coli CC118. The bands corresponding to the predicted molecular masses of various fusion proteins are marked by asterisks. The arrow denotes a 47-kDa band corresponding to the size of the normal PhoA protein. Lane 1, no plasmid; lanes 2 to 7, fusion constructions created with primers B1 to B6 (Table 1), respectively.

