. 2022 Aug 17;130(8):087001. doi: 10.1289/EHP11092

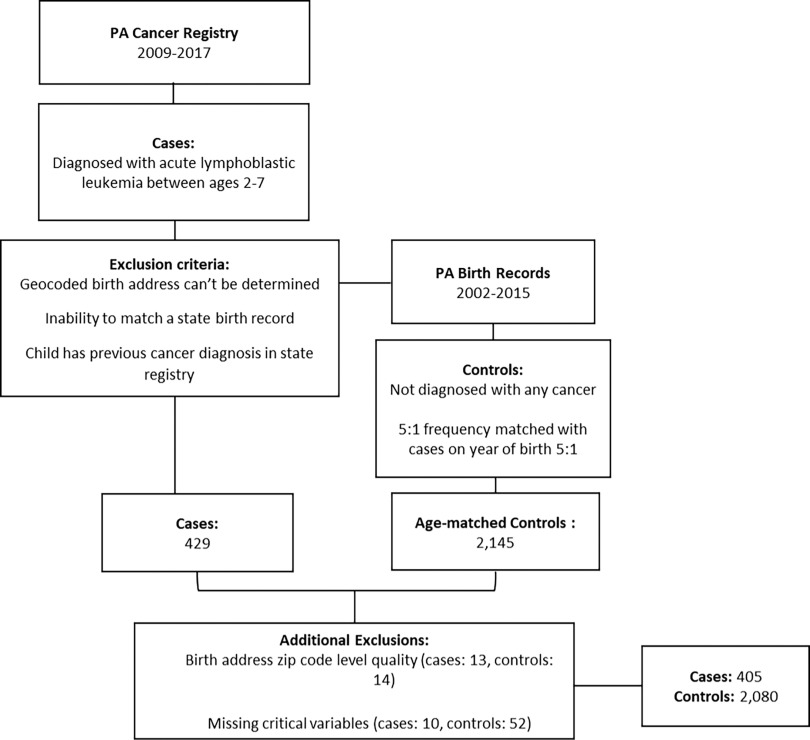
Figure 1.

Figure 1 is a flowchart with four steps. Step 1: Pennsylvania cancer registry data were abstracted between 2009–2017, including cases of acute lymphoblastic leukemia diagnosed between ages 2 and 7, and excluding geocoded birth addresses that cannot be determined, inability to match a state birth record, and children who have previous cancer diagnosis in the state registry. There were a total of 429 cases. Step 2: Controls, which are children not diagnosed with any cancers, were drawn from Pennsylvania birth records (2002–2015) and frequency matched with cases on year of birth at a ratio of 5 to 1. The number of age-matched controls was 2145. Step 3: 429 cases and 2145 age-matched control cases lead to additional exclusions, including 13 cases and 14 controls under birth address zip code level quality, and 10 cases and 52 controls under missing critical variables. Step 4: There are a total of 405 cases and 2080 controls.

Data sources and selection process for Pennsylvania cases and controls (2009–2017).