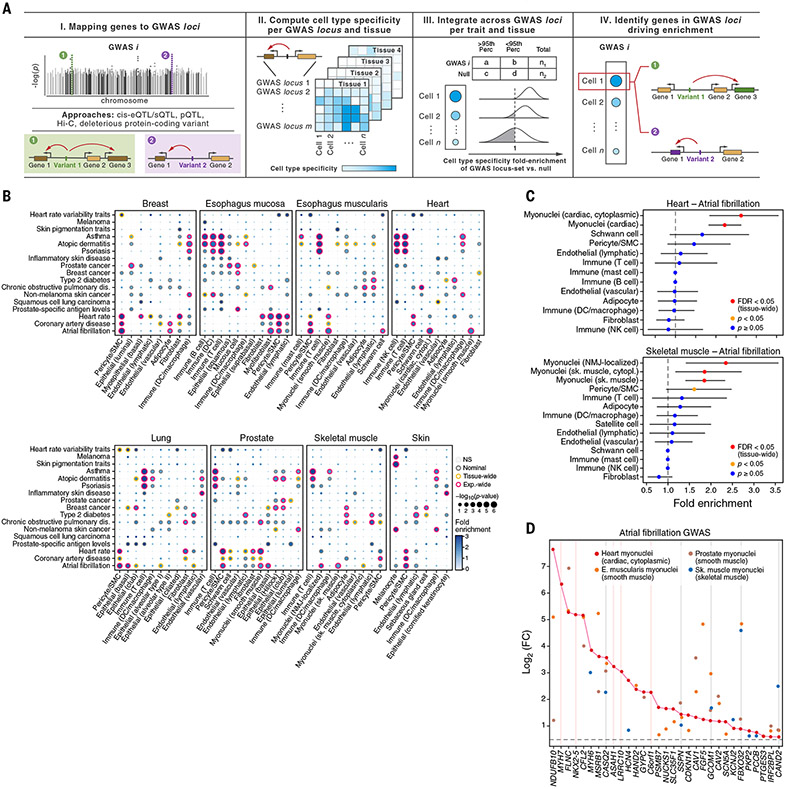
Fig. 6. Cell type–specific enrichment of eQTL and sQTL target genes mapped to GWAS loci.
(A) Schematic of the method (ECLIPSER). (B) Cell-type enrichment of genes mapped to GWAS loci for 17 of the 21 complex traits tested with at least one tissue-wide significant result (FDR < 0.05, correcting for all cell types tested per tissue per trait) across eight GTEx tissues. Gray, orange, and red borders indicate nominal, tissue-wide, and experiment-wide significance (FDR < 0.05, correcting for all cell types tested across eight tissues and 21 traits), respectively. Only cell types with at least one tissue-wide enrichment are shown. (C and D) Myonuclei and pericyte genes enriched in atrial fibrillation GWAS loci (tissue-wide FDR < 0.05, Bayesian Fisher’s exact test). Fold-enrichment (x axis) of cell types (y axis) for atrial fibrillation GWAS in heart (top) and skeletal muscle (bottom) is shown in (C). Error bars represent 95% credible intervals. Red indicates tissue-wide significance, orange indicates nominal significance, and blue indicates nonsignificance (P ≥ 0.05, Bayesian Fisher’s exact test). Differential expression in myonuclei versus other cell types from heart (red), skeletal muscle (blue), esophagus muscularis (orange), and prostate (brown) of the genes (x axis) driving enrichment of atrial fibrillation GWAS loci in heart cardiac myonuclei is shown in (D). Gray and pink vertical lines indicate log2(fold change) > 0.5 and FDR < 0.1 in myonuclei in all four tissues or only in heart, respectively. FC, fold change.

