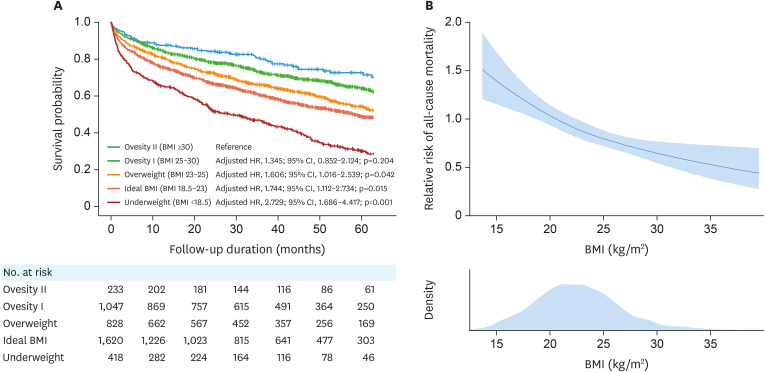
Figure 1. Risk of all-cause mortality according to the BMI. (A) All-cause mortality-free survival is shown according to the BMI category: BMI <18.5 kg/m2 (underweight), BMI 18.5–23 kg/m2 (ideal BMI), BMI 23–25 kg/m2 (overweight), BMI 25–30 kg/m2 (obesity class I), and BMI ≥30 kg/m2 (obesity class II). (B) The association of the risk of all-cause mortality with BMI is shown in the spline curve.
BMI = body mass index; HR = hazard ratio; CI = confidence interval.

