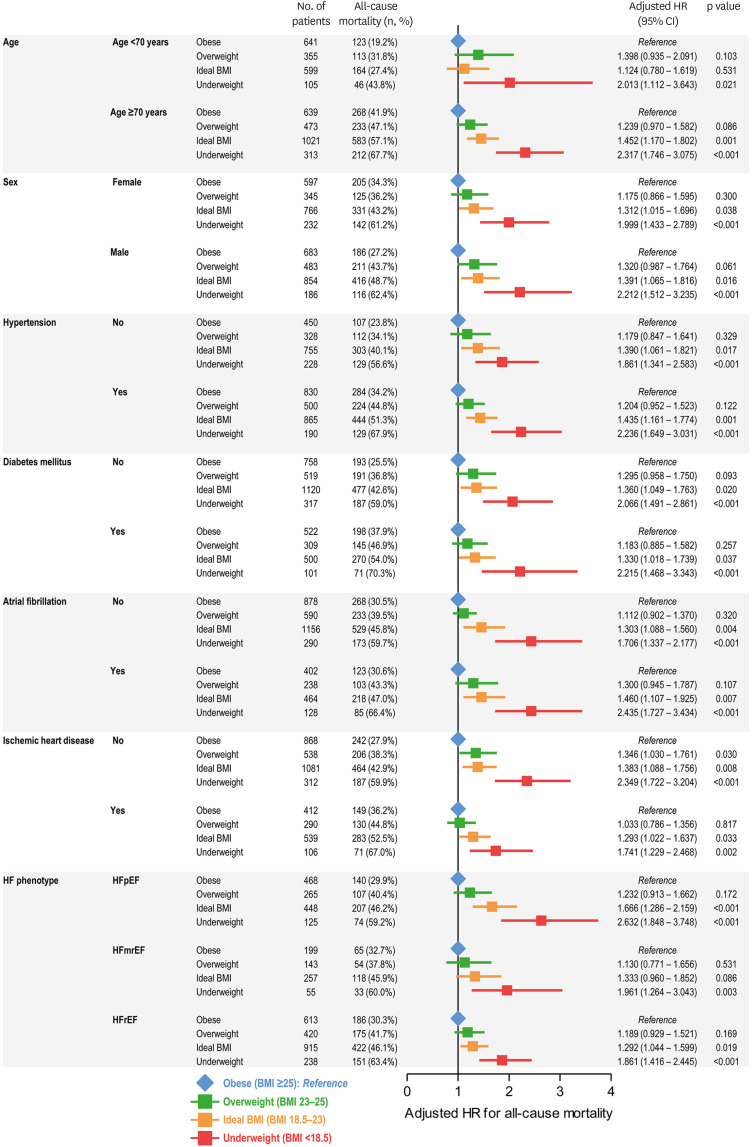
Figure 3. Subgroup analyses for all-cause mortality according to the BMI classification. The adjusted HRs are shown for all-cause mortality in subgroups based on age, sex, hypertension, diabetes mellitus, atrial fibrillation, ischemic heart disease, and phenotype of HF. Using the patients with BMI >25 kg/m2 (obese) as reference (blue), the HRs of patients with overweight (green), ideal BMI (orange), and underweight (red) are summarized.
HR = hazard ratio; CI = confidence interval; BMI = body mass index.

