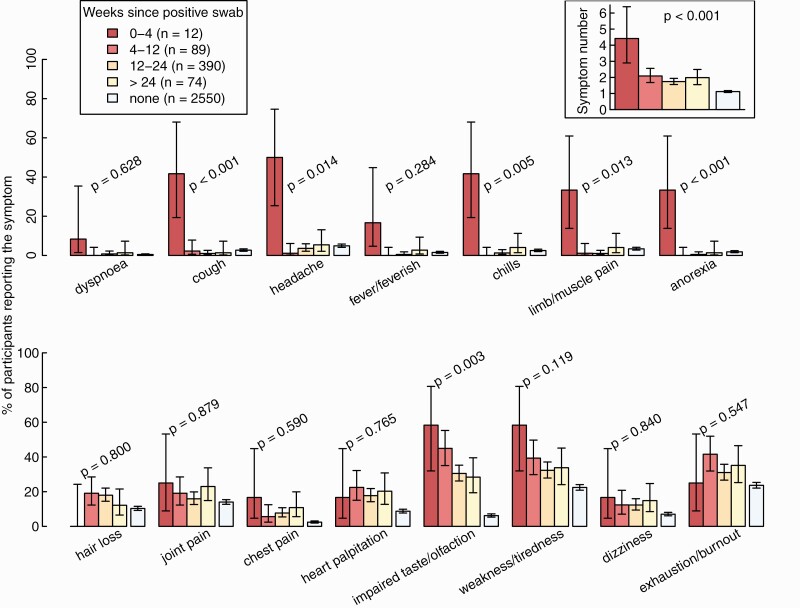
Figure 4.
Percentage of healthcare workers reporting individual symptoms and total number of reported symptoms (upper right corner) according to weeks since positive SARS-CoV-2 swab, compared with negative controls. Statistics: P values from tests for trends over the 4 categories, without negative controls. Abbreviation: SARS-CoV-2, severe acute respiratory syndrome coronavirus 2.

