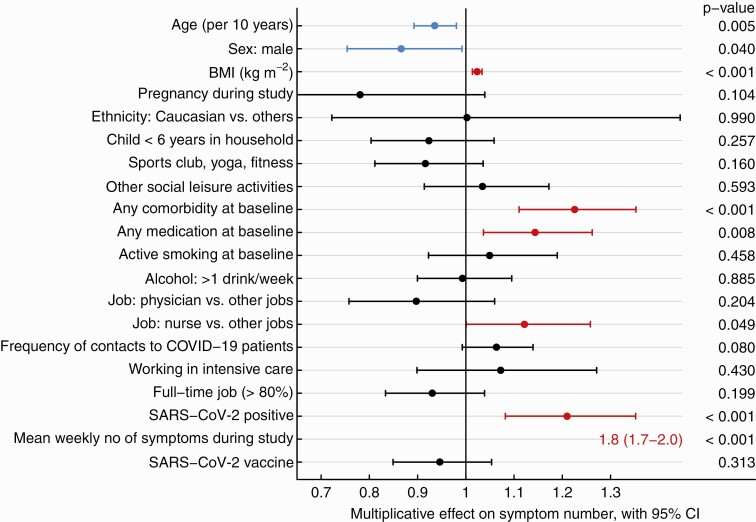
Figure 6.
Forest plot showing the multiplicative effect of potential influential factors on the number of long-COVID symptoms, as determined through multivariable Poisson regression. Factors in blue are negatively and those in red are positively associated with the number of symptoms. Abbreviation: BMI, body mass index; CI, confidence interval; COVID, coronavirus disease; COVID-19, coronavirus disease 2019; SARS-CoV-2, severe acute respiratory syndrome coronavirus 2.

