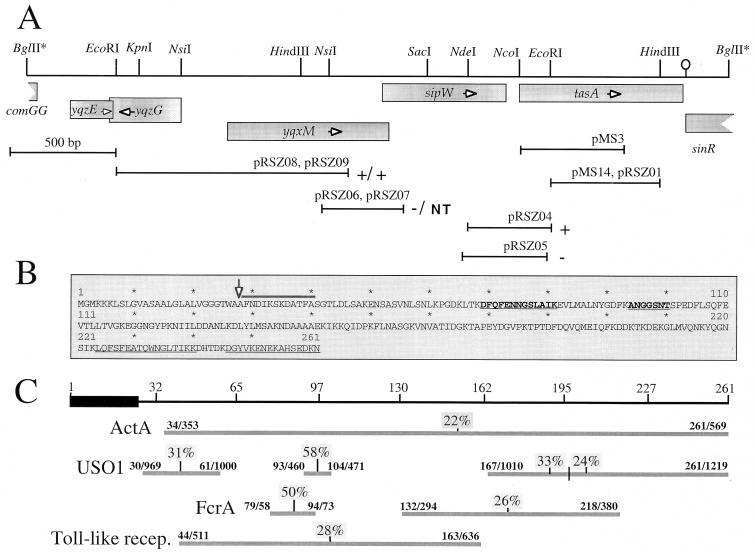
FIG. 1.
Chromosomal organization and structure of tasA. (A) Partial restriction map and genetic organization of the tasA region. The boxes below the restriction map indicate the extent and direction of transcription of the different cistrons in the region, as deduced from the analysis of the B. subtilis genome sequence (22). The stem-and-loop structure downstream of tasA indicates the position of a possible transcription terminator. The lines below the restriction map represent DNA fragments cloned into the indicated plasmids. The plus or minus sign to the right of a plasmid denotes the Lac phenotype of a B. subtilis strain carrying a transcriptional fusion of the corresponding fragment to the lacZ gene inserted in single copy at the amyE locus or at the tasA region, respectively (see text). pRSZ04 (integrating at the tasA region) and pRSZ05 (amyE integrational) are shown in separate lines, since the inserts in each plasmid differ slightly. “NT” indicates that no transformants of pRSZ07 were obtained. (B) Deduced primary structure of TasA. The thick line above the sequence denotes the N-terminal amino acid sequence determined by the Edman reaction of the coat-associated TasA polypeptide. The first 23 residues of TasA are thought to be a signal peptide, and the processing site is indicated by a vertical arrow. The internal segments underlined were determined by MALDI mass spectrometry analysis, after cleavage of a six-His-S.Tag-TasA fusion protein with Lys-C protease (see Materials and Methods). The sequences in boldface were determined by the Edman reaction. (C) Regions of sequence similarity between TasA and the indicated proteins. The numbers above the horizontal lines indicate the residues that delimit those regions in both proteins. The numbers above the vertical lines indicate the percentages of sequence identity for the indicated segments. The ActA, USO1, FcrA, and Toll-like protein sequences have the following database accession numbers: S20887, Z74106, S35760, and U88879, respectively. recep., receptor.

