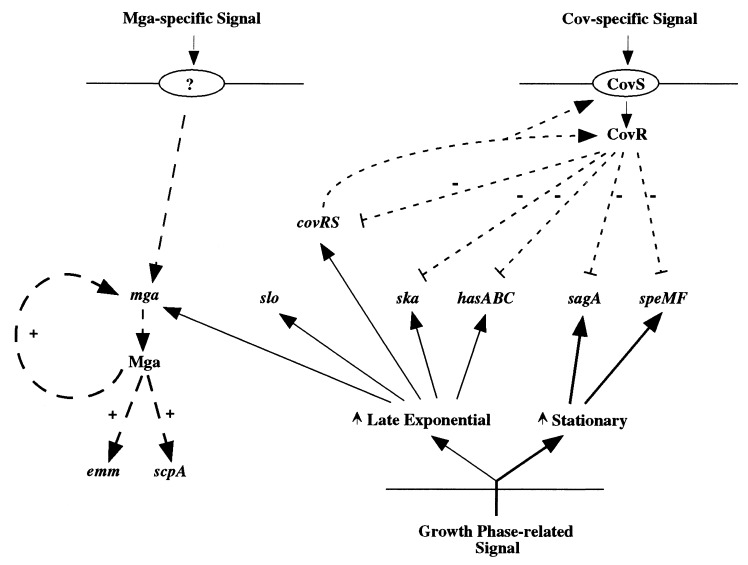
FIG. 5.
Model of regulatory networks in GAS. Positive regulation is indicated by +, and negative regulation is indicated by −. Lines with short dashes represent CovR regulation, and lines with long dashes represent regulation by Mga. Solid lines indicate regulation correlated with growth phase either in exponential phase (light lines) or stationary phase (heavy lines).

