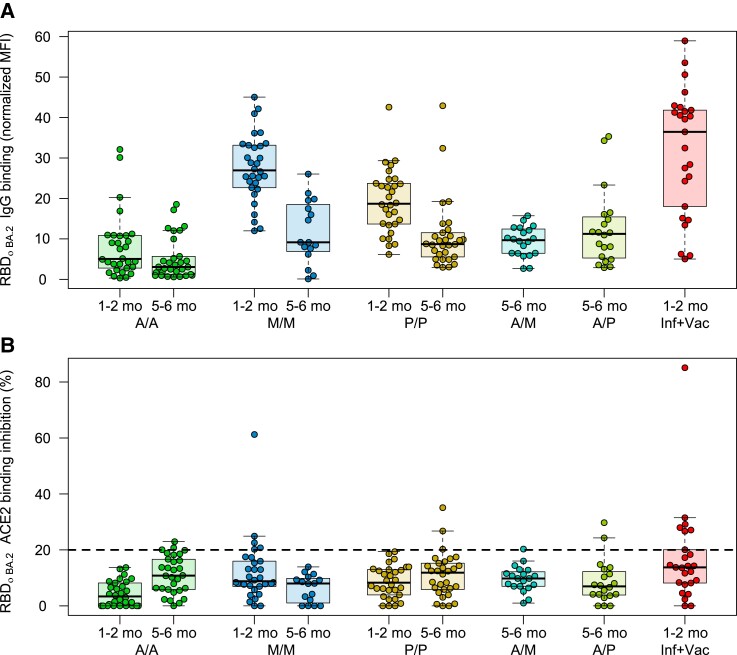
Figure 3.
Differences in Omicron binding response among different populations of vaccinated samples. Binding response toward Omicron BA.2 was analyzed by either MULTICOV-AB (A) or RBDCoV-ACE2 (B) assays for samples from different vaccine schemes (n = 30 for all samples, except for mRNA-1273 at 5–6 months (n = 16), heterologous vaccine schemes (both n = 20), and infected and vaccinated (n = 25). To determine the effect of time postvaccination, samples from both 1–2 months and 5–6 months postvaccination were included. Boxes represent the median with 25th and 75th percentiles; whiskers show the largest and smallest nonoutlier values. Outliers were determined by 1.5 interquartile range. The 20% cutoff for nonresponders is indicated by the dashed line on (B). The equivalent data for BA.1 are provided as Supplementary Figure 3. Abbreviations: A/A, AZD1222; ACE2, angiotensin-converting enzyme 2; A/M, first dose AZD1222, second dose mRNA-1273; A/P, first dose AZD1222, second dose BNT162b2; IgG, immunoglobulin G; Inf, infected; MFI, median fluorescence intensity; M/M, mRNA-1273; P/P, BNT162b2; RBD, receptor-binding domain; Vac, vaccinated.

