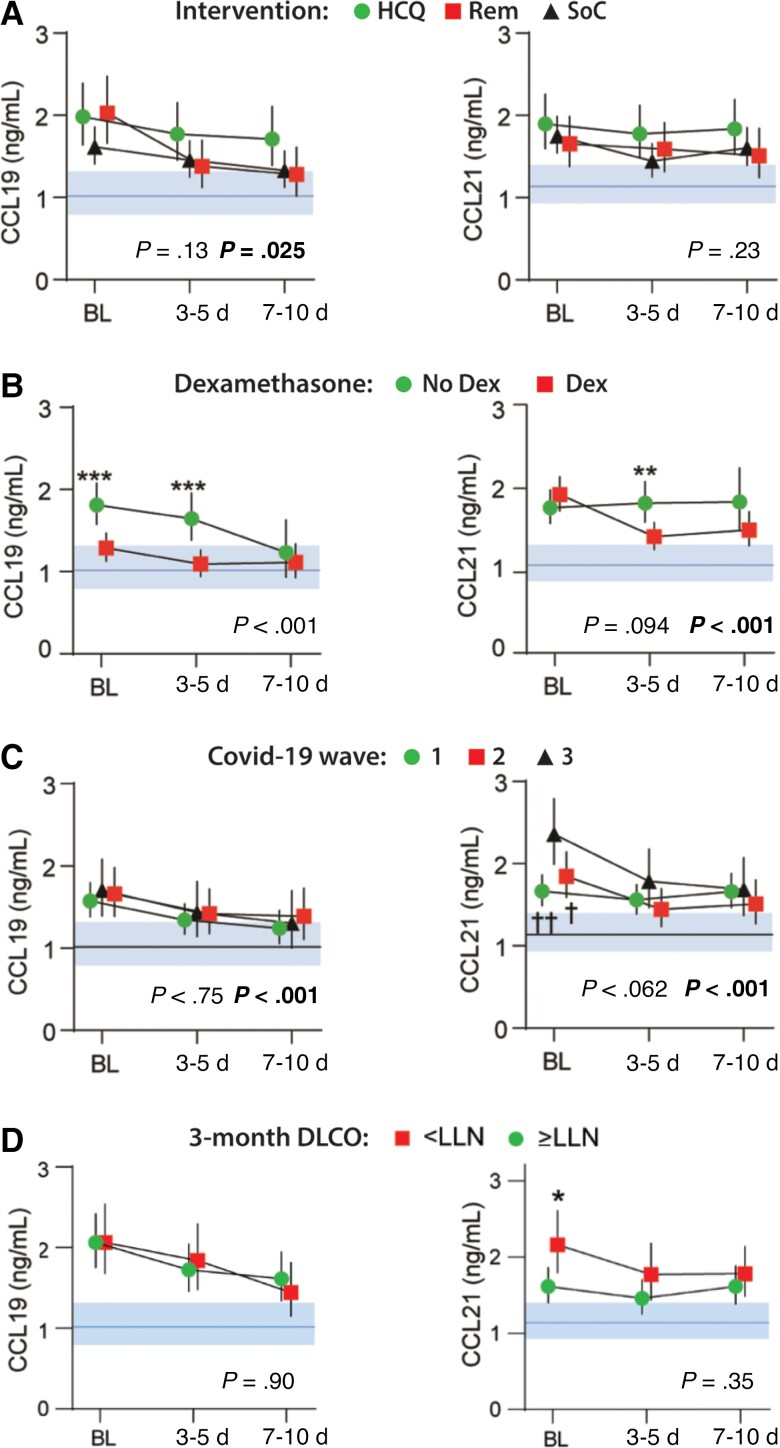
Figure 4.
Intrahospital temporal profile of CCL19 and CCL21 according to (A) treatment with hydroxychloroquine (n = 43) and remdesivir (n = 38) as compared with their respective SoC (n = 81) in cohort 1 (NOR Solidarity trial); (B) dexamethasone treatment; (C) COVID-19 wave; and (D) Dlco below or above LLN at 3-month follow-up. Data is shown as estimated marginal means and 95% CI. The P value indicates group effect, and the bold P value indicates the interaction term between time and group from the linear mixed models with subject as random effect, and time and mortality as fixed effects (also as interaction) in addition to age, sex, and estimated glomerular filtration rate. Shaded areas show reference value range from healthy controls. *P < .01, ***P < .001 between groups; †P < .05, ††P < .01 versus wave 3. Abbreviations: Dlco, diffusing capacity of the lungs for carbon monoxide; LLN, lower limit of normal; HCQ, hydroxychloroquine; REM, remdesivir; SoC, standard of care.

