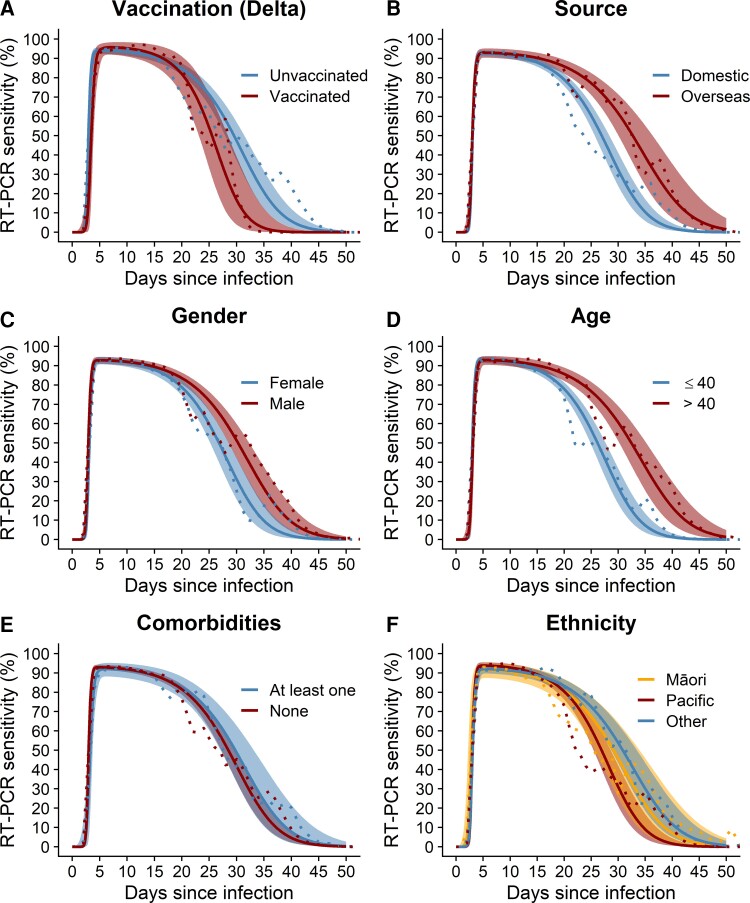
Figure 3.
Reverse transcription polymerase chain reaction (RT-PCR) test sensitivity over days since time of infection for different groups by (A) vaccination status, (B) source of infection, (C) gender, (D) age group, (E) presence of comorbidities, and (F) ethnicity. Median (solid lines) and 95% credible interval (shaded regions) for the probability of testing positive θ and empirical mean (dotted line).

