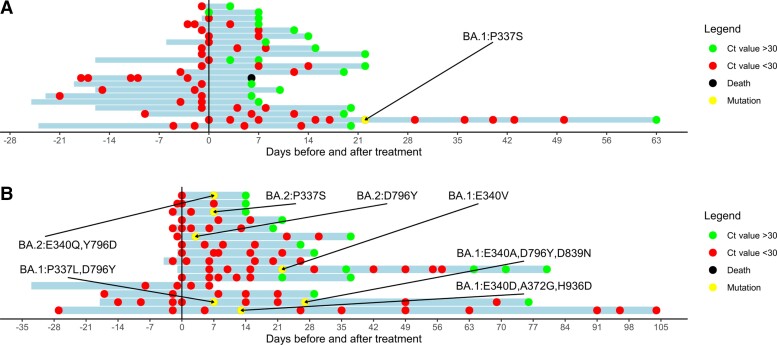
Figure 1.
Follow-up of viral load in immunocompromised patients infected with the severe acute respiratory syndrome coronavirus 2 (SARS-CoV-2) Omicron variant. Ct value of patients treated with sotrovimab with a baseline real-time polymerase chain reaction (RT-PCR) and at least 1 follow-up RT-PCR available. The y-axis indicates the day of sotrovimab infusion. The x-axis represents the time before/after sotrovimab infusion. Red dots represent a Ct value <30. Green dots represent a Ct value >30. Black dots represent the death of a patient. Yellow dots represent a sequence showing new spike mutations compared with the baseline sequence. Omicron sublineage and type of spike mutation are reported. The blue bars represent the period of follow-up, which started on the date of the first positive SARS-CoV-2 test and lasted until the last SARS-CoV-2 PCR at the Erasmus Medical Center (MC) or until death. In several patients, no dots are at the start of follow-up meaning that the first SARS-CoV-2 PCR test was not performed at Erasmus MC or that the test was performed on a device that did not report Ct values. A, Patients for whom not all pre- and post-treatment PCR sequencing was successful. B, Patients for whom all pre- and post-treatments PCR sequencing was successful. Five patients were lost to follow-up. Abbreviation: Ct, cycle threshold.

