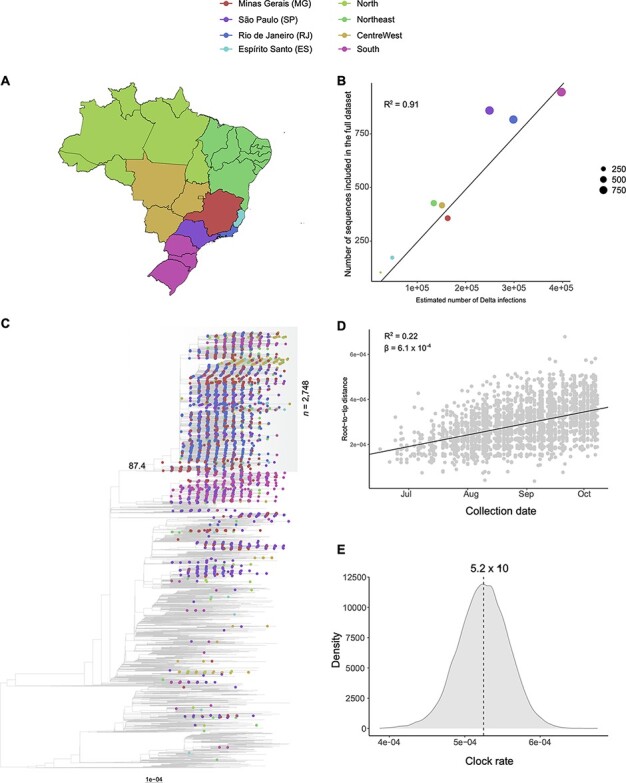
Figure 4.

Phylogenetic analysis and investigation of the temporal signal of the proportional dataset (n = 9,498). (A) Map of Brazil with discrete locations (federal states or regions). (B) Linear regression displays a strong correlation (R2 = 0.91) between the number of estimated Delta infections and sequences in the dataset per location, reflecting the proportional sampling scheme. (C) Maximum-likelihood phylogenetic tree inferred from the dataset. Root position was defined by optimizing the correlation between sample collection dates and genetic distances under the molecular clock hypothesis. Tip shapes from Brazilian sequences are colour coded according to the map in panel A. Scale bar indicates substitutions per site. The TreeTime mugration method estimates 113 different introductions of VOC Delta in Brazil. Only three Brazilian clades with more than 100 sequences have been identified, being over 80% of all MG sequences included in the largest of them (n = 2,748; SH-aLRT = 87.4; marked in grey shading). (D) Root-to-tip distance plot inferred from the maximum-likelihood tree inferred for the major Brazilian clade. This plot suggests the dataset contains a clock-like signal (R2 = 0.22; β = 6.1 × 10⁻⁴). (E) Bayesian posterior distribution of the clock rate estimated for the major Brazilian clade (median: 5.2 × 10⁻⁴ s/s/y; 95 per cent HPD: 4.6 × 10⁻⁴–5.9 × 10⁻⁴ s/s/y). This rate was estimated on BEAST with a dataset comprehending 275 randomly selected sequences from the clade, covering all of its temporal spans.
