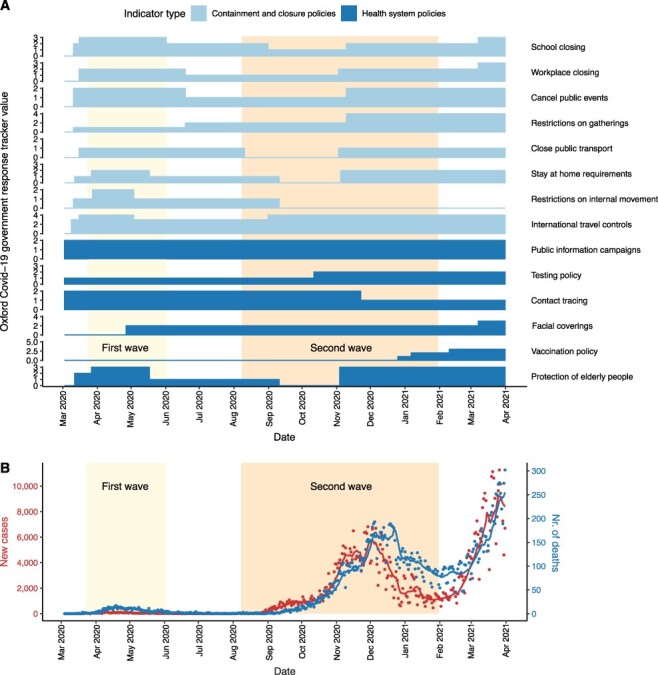
Figure 1.

Public health interventions and case counts for the first two waves in Hungary. (A) Timeline of public health interventions as measured by the Oxford COVID-19 government response tracker values based on data related to Hungary in the global panel database of pandemic policies (Hale et al. 2021). ‘Containment and closure policy’ values and selected ‘health system policy’ values quantify non-pharmaceutical interventions from the date of the first SARS-CoV-2 genome sampled in Hungary (3 March 2020) until the date of the last genome sample included in the analysis (31 March 2021). Scales of the y-axes correspond to the number of categories that a given type of intervention variable can take (between 0–2 and 0–5). For further information on the dataset, see Supplementary Table ST2. (B) Number of new confirmed COVID-19 cases and deaths caused by COVID-19 per day between the date of the first case and the last available SARS-CoV-2 genome sequence sampled in Hungary. Dots represent actual data (Ritchie et al. 2020), while lines represent 7-day moving average values. The first and last dates of the waves were defined based on the 7-day moving average of confirmed COVID-19 cases in Hungary: the first wave (light yellow background) lasted from 3 March 2020 (first confirmed case) to 2 June 2020 (i.e. when the rolling mean dropped to less than 20). The second wave lasted from 8 August 2020 (i.e. when the 7-day moving average increased above 20) to 31 January 2021, when the third wave started.
