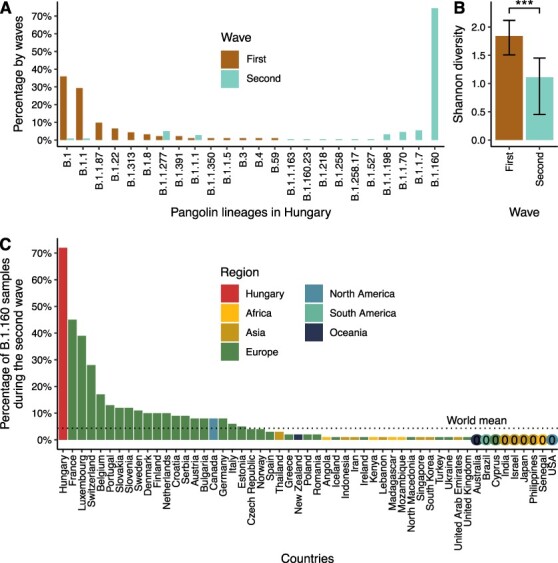
Figure 2.

Different viral diversity patterns in the first and second waves of the pandemic in Hungary. (A) Prevalence of circulating SARS-CoV-2 Pangolin lineages in the first two waves shown as percentages of genome sequences in each wave. Waves are colour-coded. The lineages shown on the x-axis are ordered by decreasing percentages in the first wave and increasing percentages in the second wave. (B) Shannon diversity indices based on Pangolin lineage distributions for the two waves (1.84 and 1.11 for the first and second waves, respectively). The confidence intervals (based on the bias-corrected and accelerated bootstrap method by using 10,000 bootstrap replicates) are shown as error bars. *** represents a significant difference, two-tailed Hutcheson t-tests: P = 2.55 × 10⁻⁶. (C) Prevalence of the B.1.160 Pangolin lineage in countries with more than 100 sequenced SARS-CoV-2 genomes during the second wave in Hungary. The numbers are based on metadata downloaded from GISAID on 9 December 2021. Bars are coloured by regions. Countries with less than 0.5 per cent of the B.1.160 Pangolin lineage are indicated with 0 and coloured by regions.
