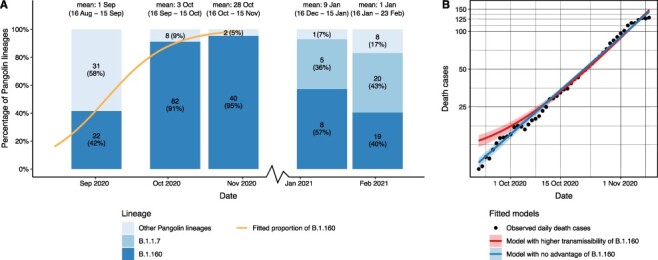
Figure 5.

No evidence for increased transmissibility of the B.1.160 variant. (A) The relative prevalence of the B.1.160, the B.1.1.7 (alpha), and all other Pangolin lineages in Hungary between 16 August and 23 February 2021. The genome sequences were grouped for each month from Day 16 to Day 15 of the next month (dates are shown above the bars), using available genome sequences for each month. Note that only a single sequence was available for December 2020, hence it was omitted from the plot. Each barplot was positioned along the x-axis at the mean of the corresponding sample collection dates. Numbers in bars indicate the actual numbers and percentages of sequenced genomes belonging to a particular Pangolin lineage. The orange line represents a logistic growth model fitted on the proportion of the B.1.160 lineage between 16 August 2020 and 15 November 2020—when the lineage B.1.160 became dominant in the country. The model assumes competition between B.1.160 and other circulating lineages (see Supplementary Notes). A net growth rate difference of 0.0773 provides the best fit to the observed proportion of B.1.160. (B) Two models were fitted to observed daily death cases (black dots): an exponential model where the B.1.160 lineage has no selective advantage, and a competition model where the B.1.160 Pangolin lineage has a net growth rate advantage of 0.0773 over other lineages.
