Figure 1.

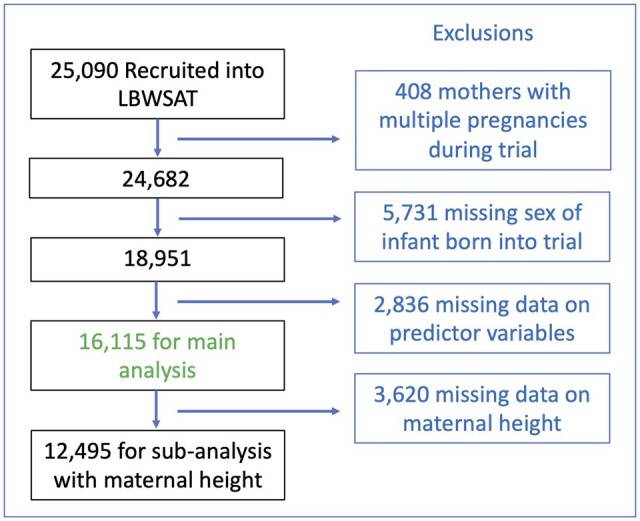
Sample selection. The flowchart illustrates our sample selection. It shows which women were excluded, and the sample size used in the main analysis and subset of women with data on height

Sample selection. The flowchart illustrates our sample selection. It shows which women were excluded, and the sample size used in the main analysis and subset of women with data on height