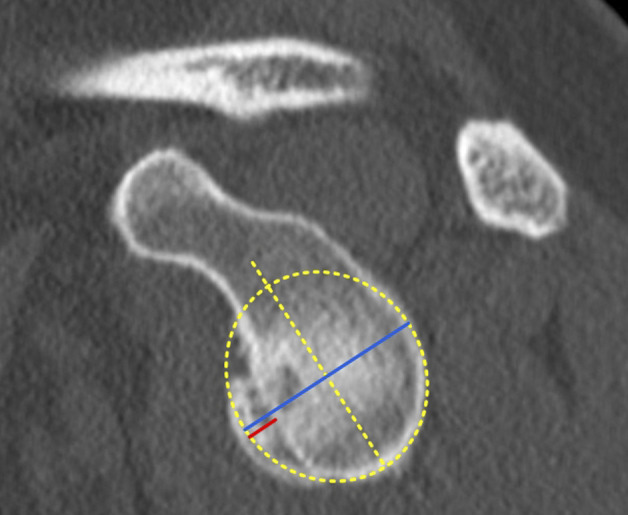
Fig. 2.

This figure shows a schematic representation of the best-fit circle width loss method. A best-fit circle was drawn on the inferior part of the glenoid on an en face view of the glenoid. The diameter (blue line) of the best-fit circle was measured. Using a parallel line to the diameter of the best fit circle, the width (red line) of the glenoid bone loss was measured [39]. A color image accompanies the online version of this article.
