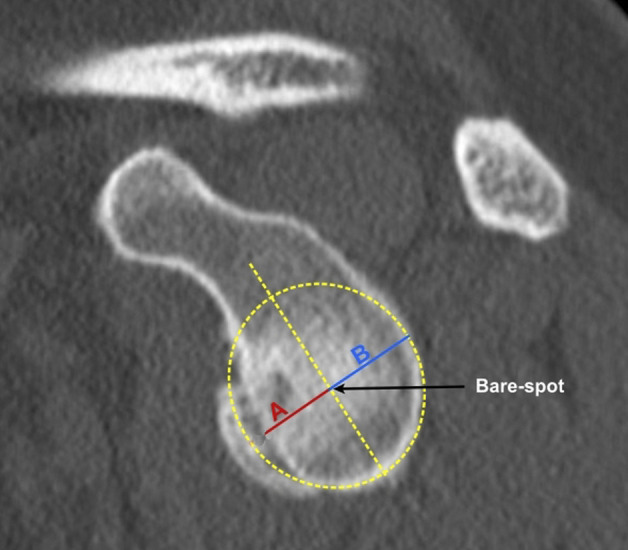
Fig. 3.

This figure illustrates the AP distance method. The bare spot was identified and a best-fit circle with the bare spot as the center was drawn over the inferior glenoid. The distance A from the bare-spot area to the anterior rim of the glenoid was measured. In the same manner, the distance between the bare spot and posterior rim of the glenoid was determined. The amount of glenoidal bone loss was then calculated using the following formula: A/B x100 [32]. A color image accompanies the online version of this article.
