
Fig. 4.
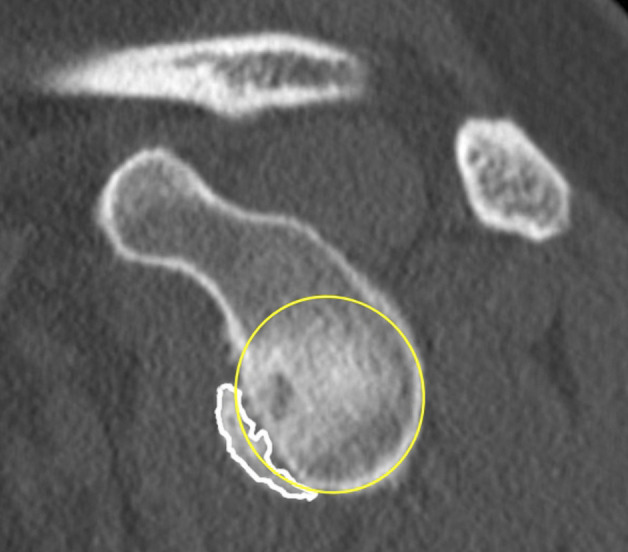
This figure shows a schematic representation of the surface area measurement method. A best-fit circle is placed on the lower two-thirds of the glenoid, starting at the 3 o’clock position (yellow circle). The area of the best-fit circle was calculated digitally. The bony fragment (white line) was identified and delineated. The surface area of the bony fragment was determined digitally. The glenoid bone loss was finally calculated by determining the ratio between the two areas [39]. A color image accompanies the online version of this article.