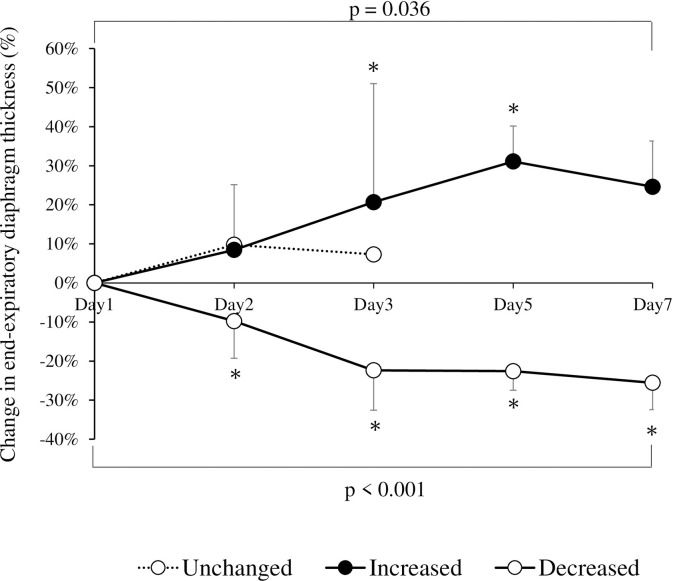
Fig 2. Changes in mean end-expiratory diaphragm thickness over time during mechanical ventilation in each group.
The error bars indicate 95% confidence intervals. p values represent statistically significant differences between at least two time points (analysis of variance). *p < 0.05 versus day 1.

