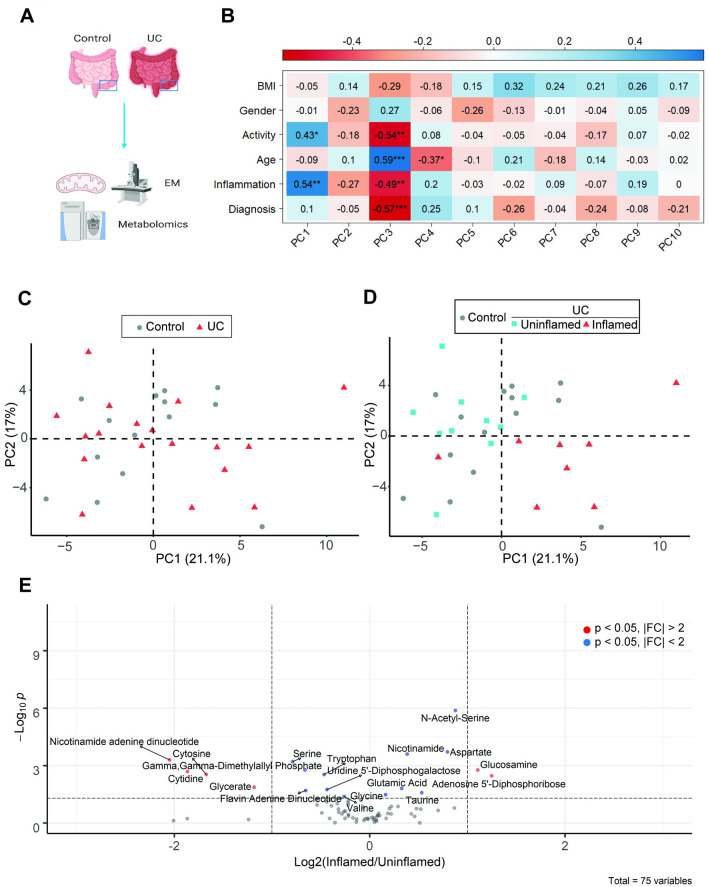
Fig 1. Metabolomic profiles of intestinal tissue cluster primarily by inflammation rather than diagnosis.
(A) Schematic of experimental design. Created with Biorender. Colonic tissue biopsies were subjected to metabolomic analysis across 2 independent experiments or mitochondrial structure analysis by electron microscopy. (B) Pearson correlation analysis of PCs and various metadata, with * p<0.05, **p<0.01, ***p<0.001 (C-D) Principal component analysis (PC1 vs PC2) of metabolomic data comparing (C) Control vs UC biopsies or (D) control vs UC biopsies further stratified by inflammation state. (E) Volcano plot of metabolites differentially regulated in uninflamed (control + UC) vs inflamed UC tissues, plotting log2(inflamed/uninflamed) vs -log10(P) value as assessed by Mann-Whitney test.

