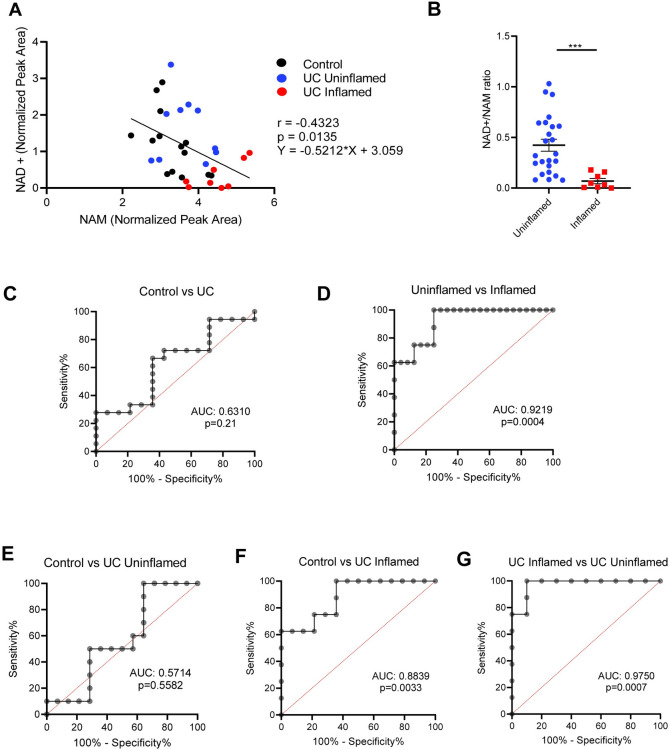
Fig 3. Intestinal NAD+/NAM ratios predict inflammation but not diagnosis.
(A) Pearson correlation analysis of normalized NAD+ vs NAM levels in various disease states. (B) Comparison of NAD+/NAM ratios in inflamed vs uninflamed (control + UC) tissues. Graph depicts mean ± SEM, *** p<0.001 by Mann-Whitney test. (C-G) Receiver operating characteristic (ROC) analysis of the ability of colon biopsy NAD+/NAM ratio to predict various disease states, with area under the curve (AUC) and p values shown. Specifically, they show the ability of NAD+/NAM ratios to distinguish (C) diagnosis, (D) inflammation state, (E) control vs uninflamed UC tissue, (F) control vs inflamed UC tissue and (G) inflamed vs uninflamed UC tissue.

