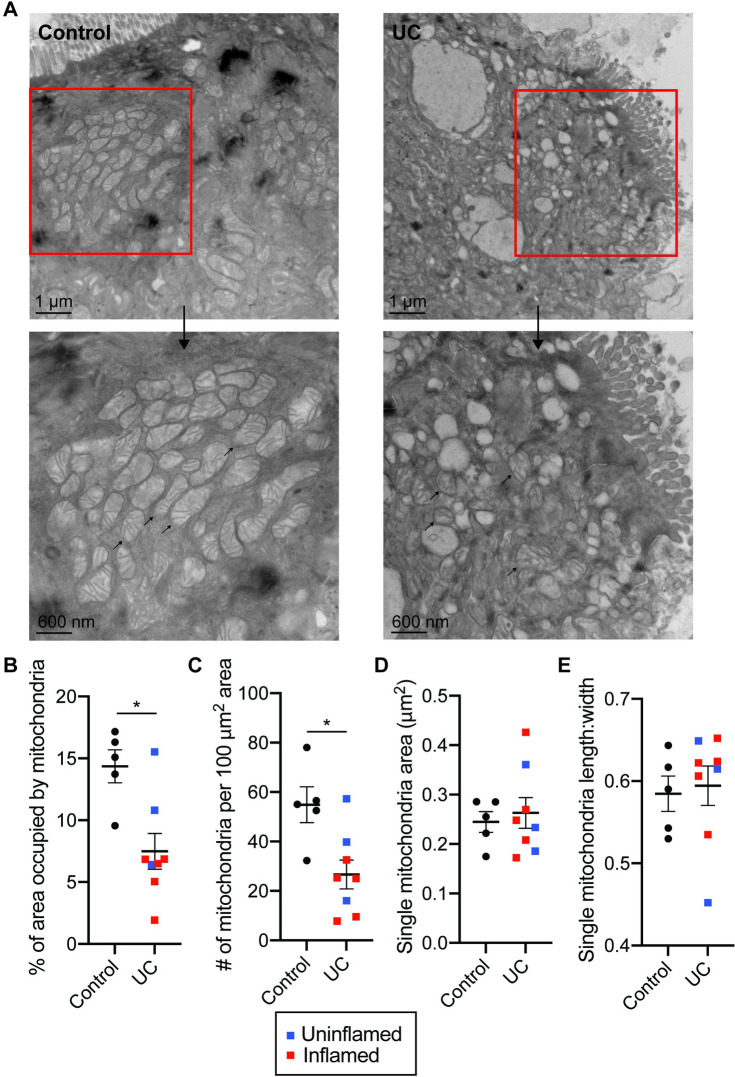
Fig 4. Mitochondrial abnormalities in UC patients.
(A) Representative EM micrographs of colon biopsy tissue from controls and UC patients, with a scale bar of 1 μm. Rectangle indicates region represented in lower panels, with a scale bar of 600 nm. Arrows indicate individual mitochondria. (B-E) Quantitation of the EM micrographs (n = 4 images per sample, 5–8 samples per group) showing changes in (B) the percent area occupied by the mitochondria between groups and (C) the number of mitochondria per 100 μm2 area, with no significant changes in (D) single mitochondrial area or (E) the roundness of mitochondria. Graphs depict mean ± SEM, *p<0.05 by Mann-Whitney test. Each point denotes the average of technical replicates for one control/patient.

