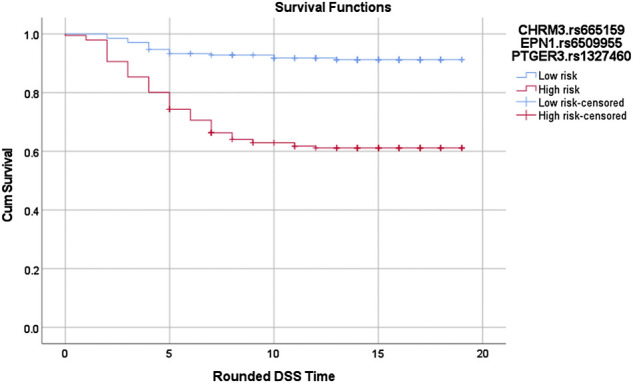
FIGURE 2.

Log-rank p = 1.02619688760668E-12. Red: high risk genotype combinations: (TC,GG,GG), (CC,AG,GG), (TC,AG,GG), (CC,AA,GG), (CC,GG,AG), (CC,AG,AG), (CC,AA,AG), (TC,AA,AG), (TC,GG,AA), (TT,GG,AA), (TC,AG,AA), (CC,AA,AA), and (TT,AA,AA). Blue: all other genotype combinations. The vertical lines on the curves denote the censored patients (e.g. patients alive at the last follow up time). X and Y axis show the follow-up time (in years; rounded) and cumulative survival, respectively.
