Fig. 2.

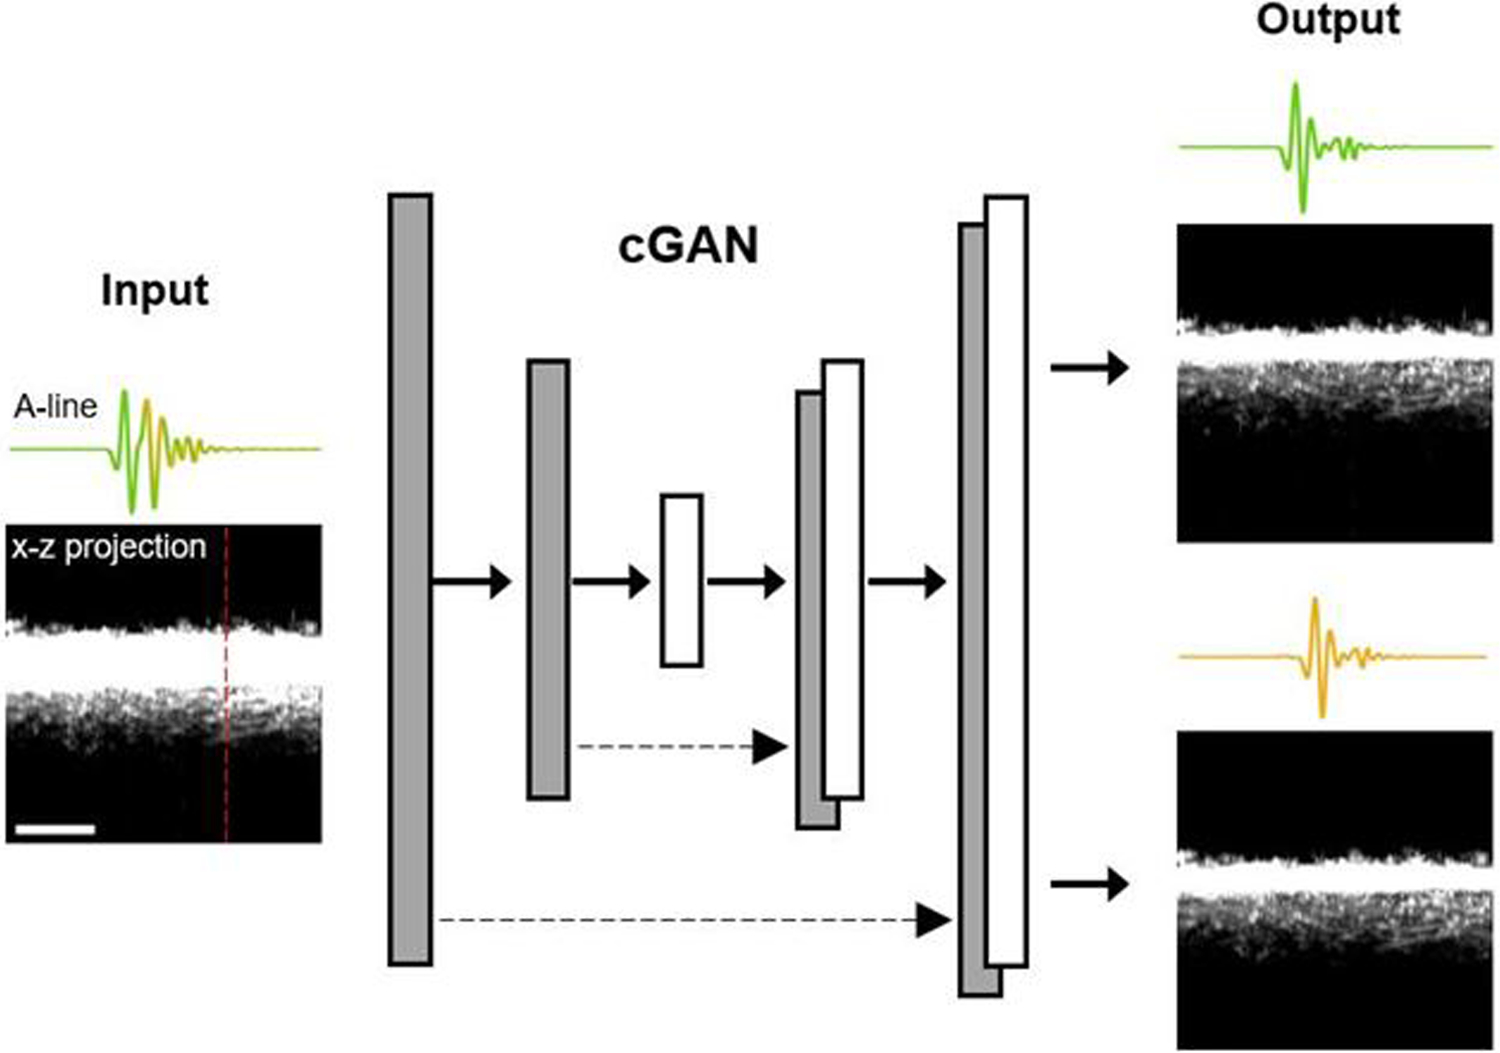
Schematic of the cGAN. The grayscale images are x-z projections of the three-dimensional dataset. A representative A-line, along the red dashed line, is shown above each of the x-z projection images. Scale bar: 300 μm.

Schematic of the cGAN. The grayscale images are x-z projections of the three-dimensional dataset. A representative A-line, along the red dashed line, is shown above each of the x-z projection images. Scale bar: 300 μm.