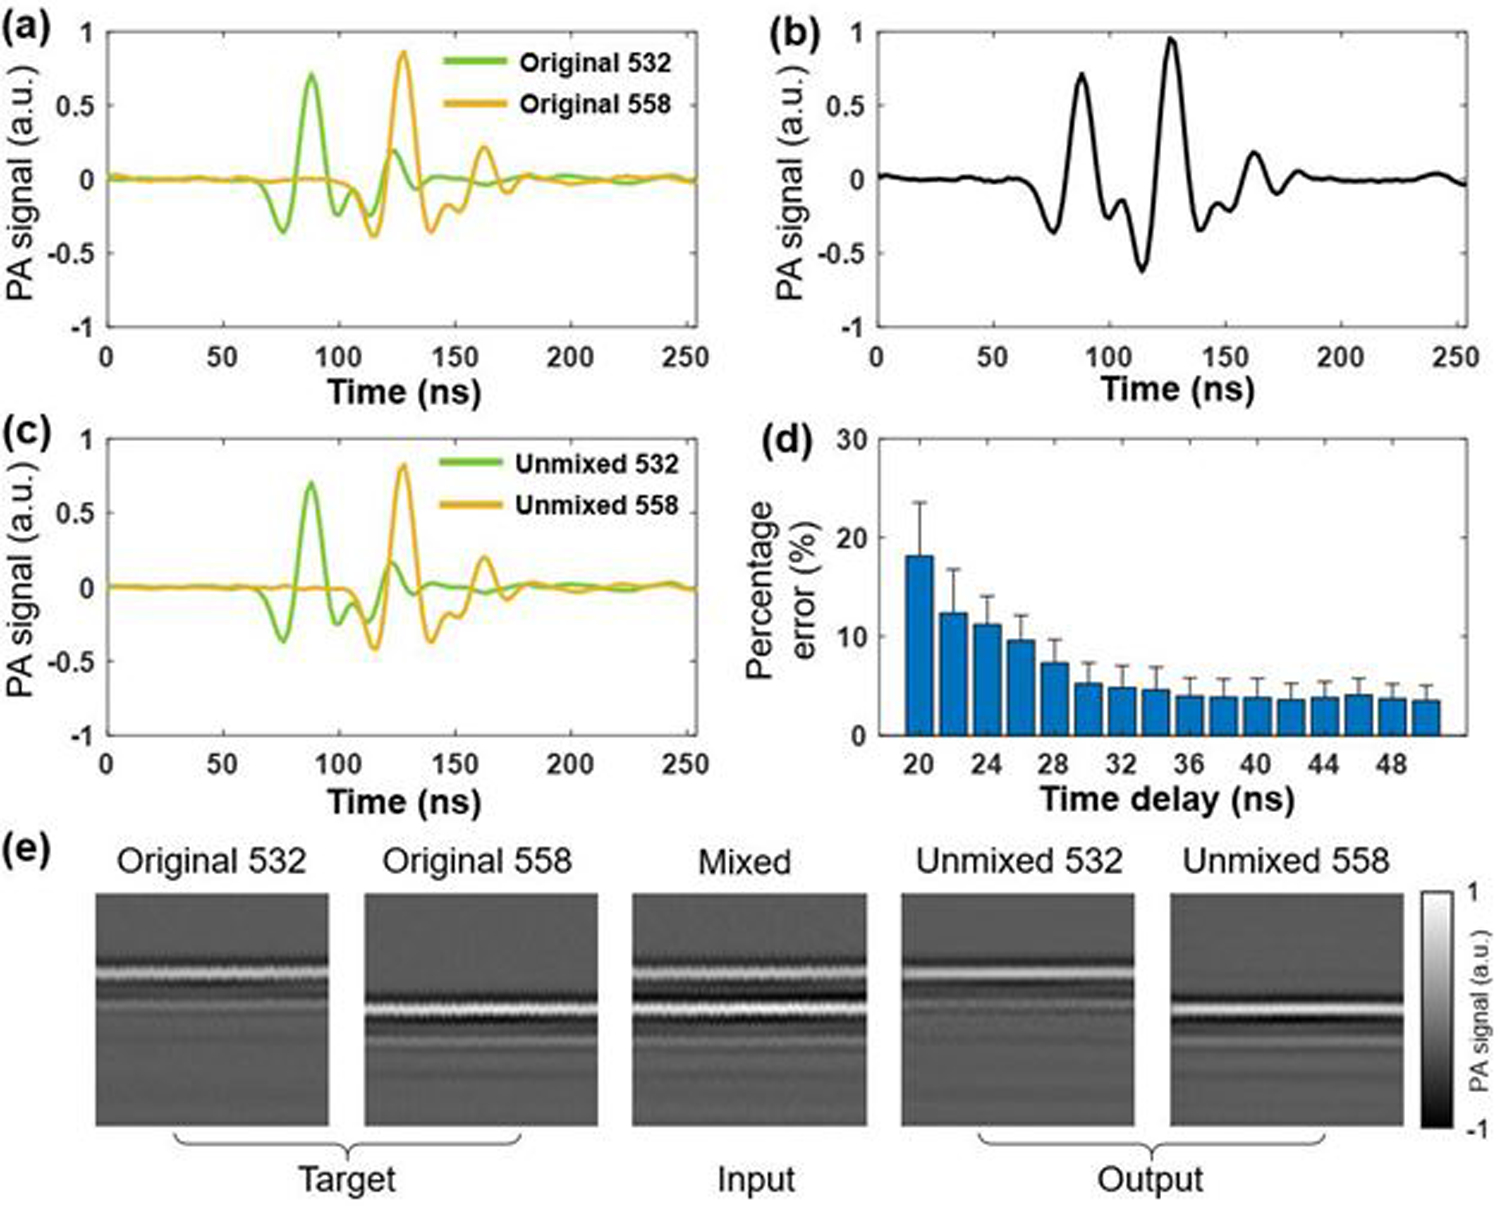
Fig. 3.

(a) 532-nm excited A-line (green) and digitally delayed 558-nm excited A-line (yellow). a.u., arbitrary units. (b) Digital sum of the two A-lines in (a). (c) Non-overlapping A-lines (green: 532 nm and yellow: 558 nm) generated by the cGAN. (d) Percentage error of sO2 values as a function of time delay. The error bars represent standard deviations. (e) Representative B-scans as the target, input, and output of the cGAN, consisting of 256 original, mixed, and unmixed A-lines, respectively.
