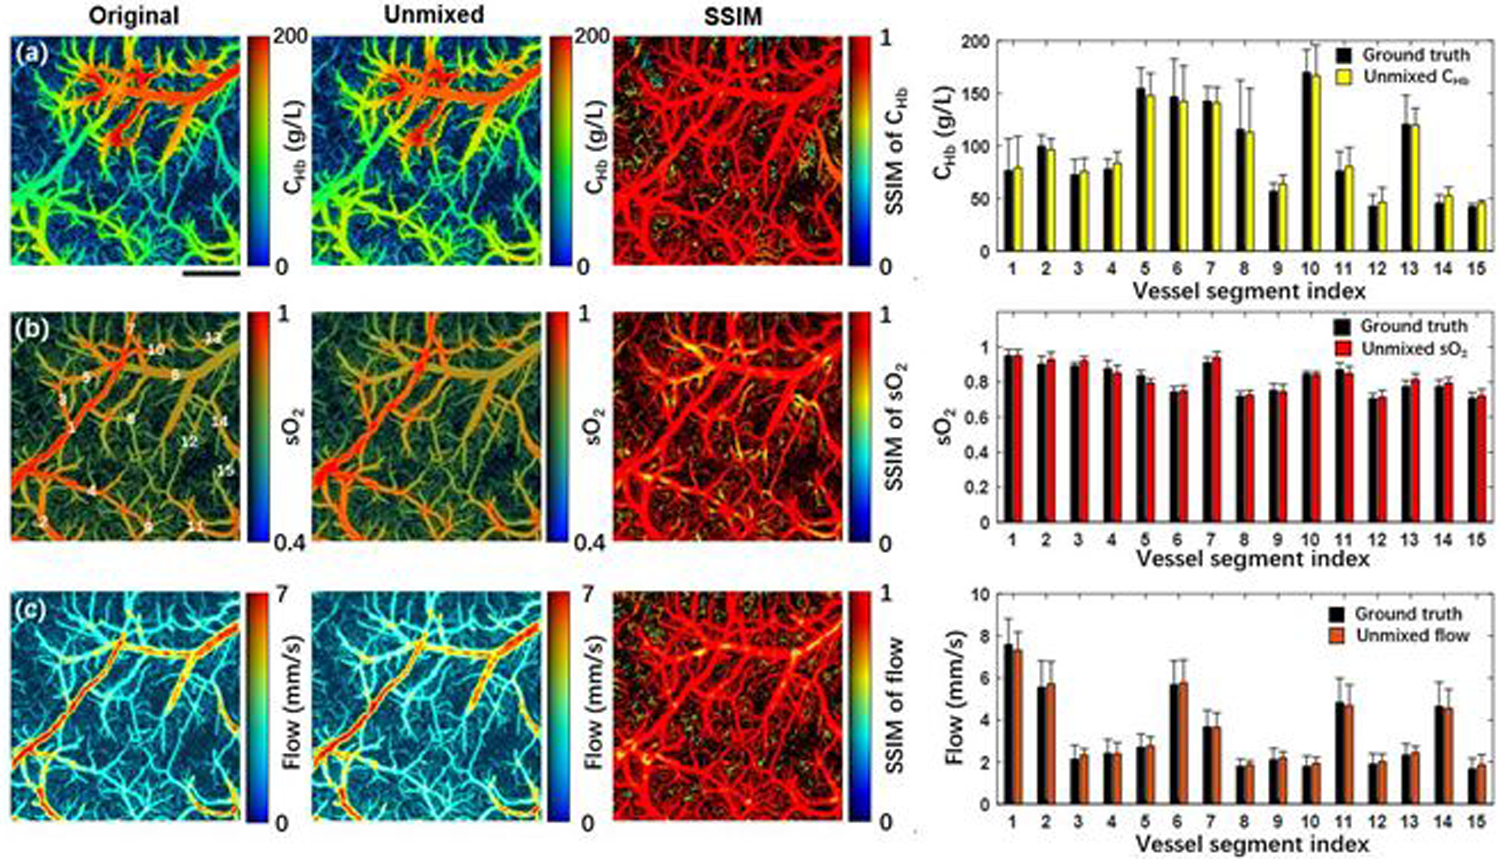
Fig. 4.

Validation of the cGAN model on a mouse brain in vivo. From left to right, (a) shows the original and the unmixed CHb, the SSIM of the two CHb, and the averaged CHb values in 15 vessel segments, where a paired t-test gives p = 0.42. (b) and (c) show values of sO2 (p = 0.41) and flow (p = 0.21), respectively. The vessel segment index is labelled in Fig. 4(b). Scale bar: 500 μm.
