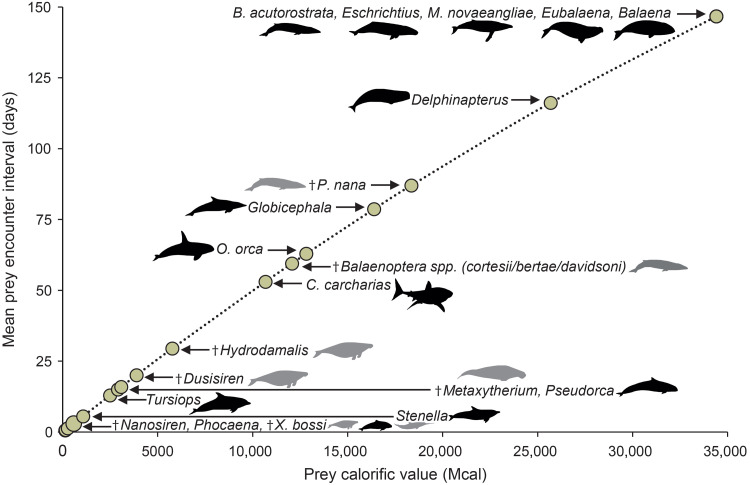
Fig. 3. Prey encounter rates.
Mean required predation rate of various putative O. megalodon prey assuming that they are the sole food source and assuming 70% assimilation efficiency for the simulated population to be maintained (see text for details). Body mass and energy densities of all prey items are recorded in Table 2. Note that the connecting line is not linear. Dagger symbols and gray animal shapes denote extinct taxa. Black animal shapes denote extant species.

