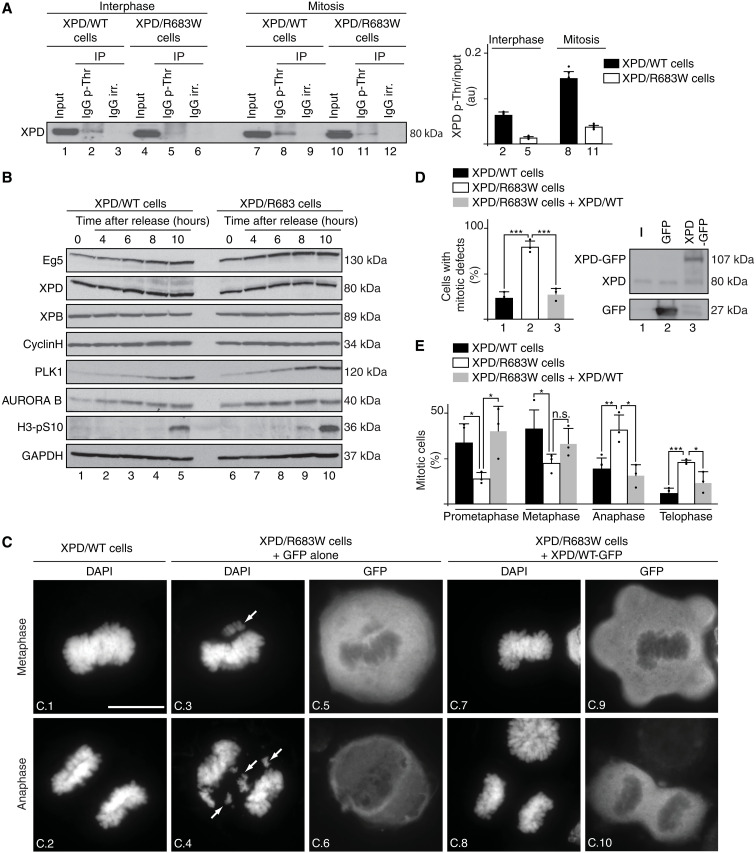
Fig. 4. Mitosis is disrupted in XP-D patient cells.
(A) Whole-cell extracts were isolated from XPD/WT and XPD/R683W cells in interphase and mitosis (upon nocodazole treatment and release for 90 min). Immunoprecipitations were performed with either irrelevant IgG (IgG irr.) or anti–phospho-threonine IgG (IgG p-Thr). The graph shows the ratio phosphorylated XPD (XPD p-Thr)/input in normal and XPD-mutated cells (n = 3, means ± SD) in au. (B) Western blot analysis (n = 3) of XPD/WT- and XPD/R683W-mutated cells synchronized with double thymidine block, released and collected at 0, 4, 6, 8, and 10 hours. glyceraldehyde-3-phosphate dehydrogenase (GAPDH) was used as loading control. (C and D) XPD/WT cells and XPD/R683W cells overexpressing the tag GFP alone or GFP-XPD/WT were analyzed in mitosis (upon nocodazole treatment and release for 90 min). The arrows point to chromosome segregation errors at metaphase and anaphase. Scale bar, 5 μm. (D) Percentage of mitotic cells displaying either a normal or a defective mitotic phenotype (at least 130 cells per experiment and per condition were counted). n = 3, means ± SD; ***P < 0.001, Student’s t test). Western Blots show overexpressed Tag GFP and XPD/WT-GFP. (E) XPD/WT cells (black bars) and XPD/R683W cells overexpressing either tag GFP alone (open bars) or GFP-XPD/WT (gray bars) were analyzed in mitosis (upon nocodazole treatment and release for 90 min). The data are shown as percent mitotic cells in each mitotic stage compared to the total cell number counted (n = 3, means ± SD; at least 130 cells per experiment and per condition were counted; *P < 0.05, **P < 0.01, and ***P < 0.001, Student’s t test).

