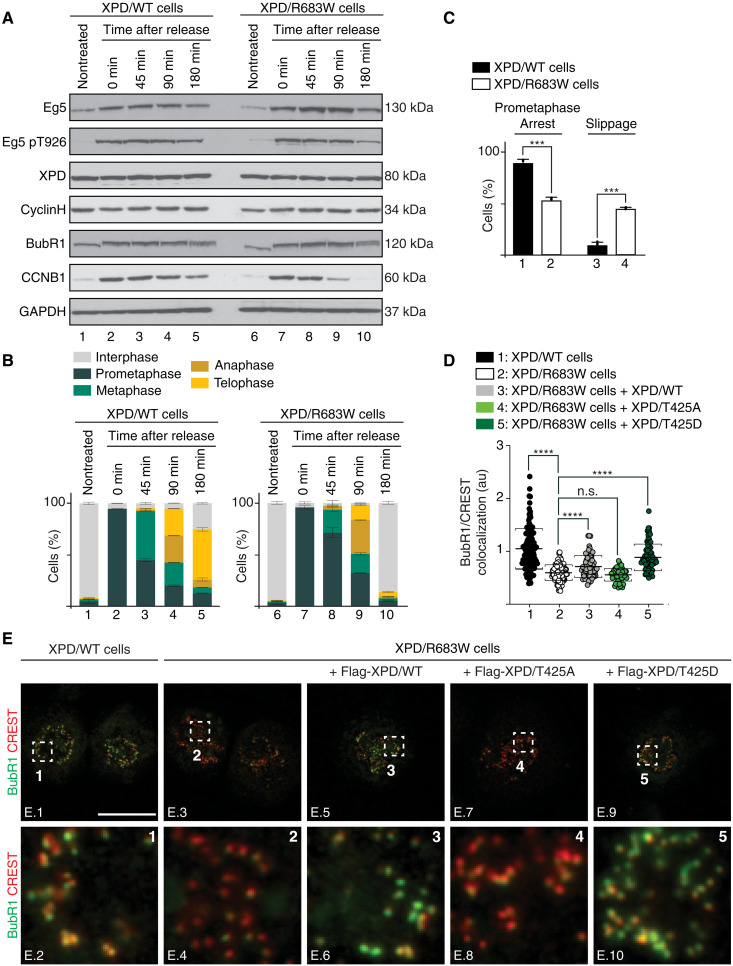
Fig. 6. Mitotic slippage in XPD-mutated patient cells.
(A and B) XPD/WT and XPD/R683W cells were synchronized with nocodazole, released, and harvested at indicated time points. (A) Whole-cell lysates were isolated and used for immunoblot analyses. GAPDH was used as loading control. (B) Fixed cells were mounted and stained with DAPI. The percentage of XPD/WT and XPD/R683W cells in different mitotic phases was quantified at the indicated time points after nocodazole release (n = 2, means ± SD; at least 200 to 250 cells were analyzed per condition and per experiment). (C) WT (black bars) and XPD/R683W (open bars) cells were treated with Taxol (16 hours, 1 μM). The percentage of cells arrested in prolonged prometaphase or exited mitosis was quantified (n = 3, means ± SD; at least 300 cells per experiment and per condition were counted; ***P < 0.001, Student’s t test). (D and E) WT and XPD/R683W cells overexpressing the Flag-Tag alone or fused to either XPD/WT, XPD/T425A, or XPD/T425D were synchronized in prometaphase with Taxol (16 hours, 1 μM). (E) Immunostaining of BubR1 and kinetochores (stained with CREST). Regions of interest are shown in the corresponding numbered panels. Scale bar, 5 μm. Unmerged images for Flag-XPD, BubR1, and CREST are provided in fig. S5B. (D) The relative intensity levels of BubR1 on individual kinetochores were quantified by using the Fiji software (n = 3, means ± SD; two-tailed Student’s t test for sample 1 versus 2 and ordinary one-way ANOVA test for sample 2 versus 3, sample 2 versus 4, or sample 2 versus 5; ****P < 0.0001).

